Accessible data visualization: make the meaning available
Pair visual clarity with useful descriptions, readable tables, keyboard controls, and exports that keep essential information intact.
Read the guideKeep the context when your chart leaves the dashboard. Explore readable image charts for articles, presentations, reports, and social posts.
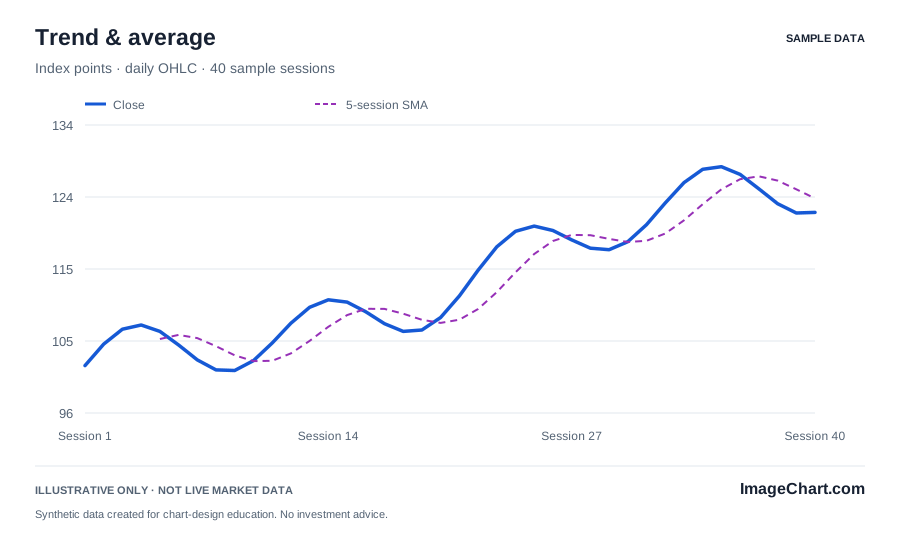
A PNG is a fixed-resolution image that fits familiar publishing workflows. An SVG preserves vector shapes and text for scalable rendering. Choose the format your destination supports, then check the actual result rather than assuming that a file extension guarantees a readable chart. Our studio exports a 1600 × 960 PNG and a self-contained SVG; the template gallery also includes 1800 × 1080 PNG files.
Keep the measure, units, selected period, and data status attached to the image. Important context should not live only in a button, tooltip, or article paragraph that disappears when the file is shared. Every ImageChart example includes its illustrative-data label in the artwork. A standalone export should remain understandable without access to its original interface.
Check small labels at the width readers will actually see. Enlarge critical text, reduce unnecessary marks, and use a short caption rather than fitting an entire report into one picture. When precise lookup matters, publish a table or CSV alongside the visual. The image shows a relationship; the data file supports verification.
Begin with a template, inspect its source values, and select a suitable view in the studio. Download the selected chart as SVG, PNG, or CSV. The examples use fixed synthetic data and do not accept private uploads. To publish your own measurements, adapt the editable SVG or the supplied chart source and verify the data, labels, and rights before release.
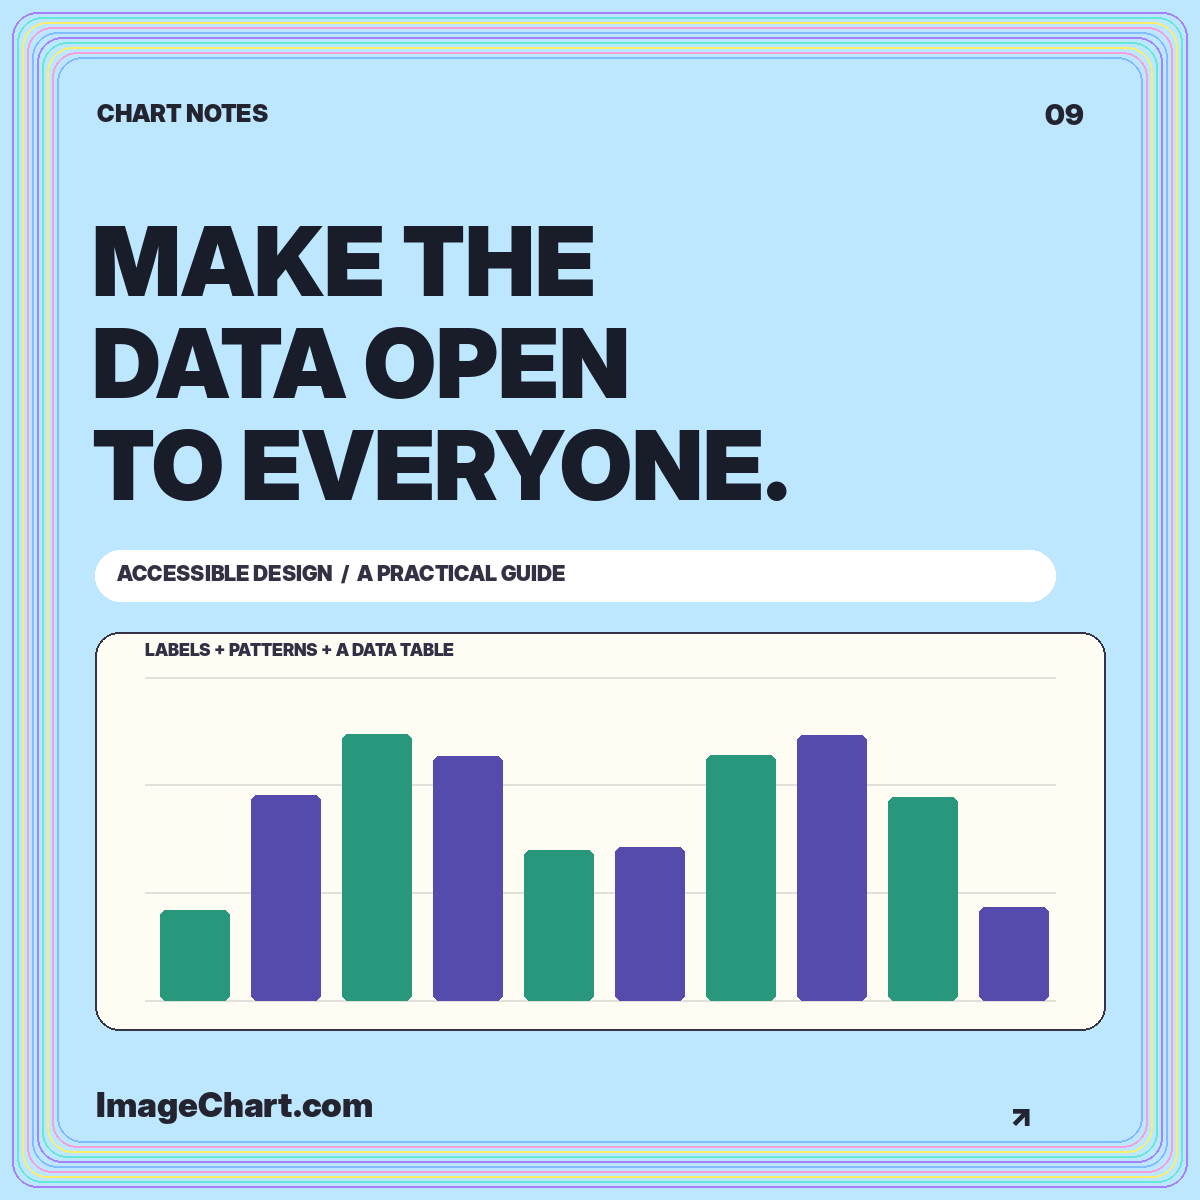
Pair visual clarity with useful descriptions, readable tables, keyboard controls, and exports that keep essential information intact.
Read the guide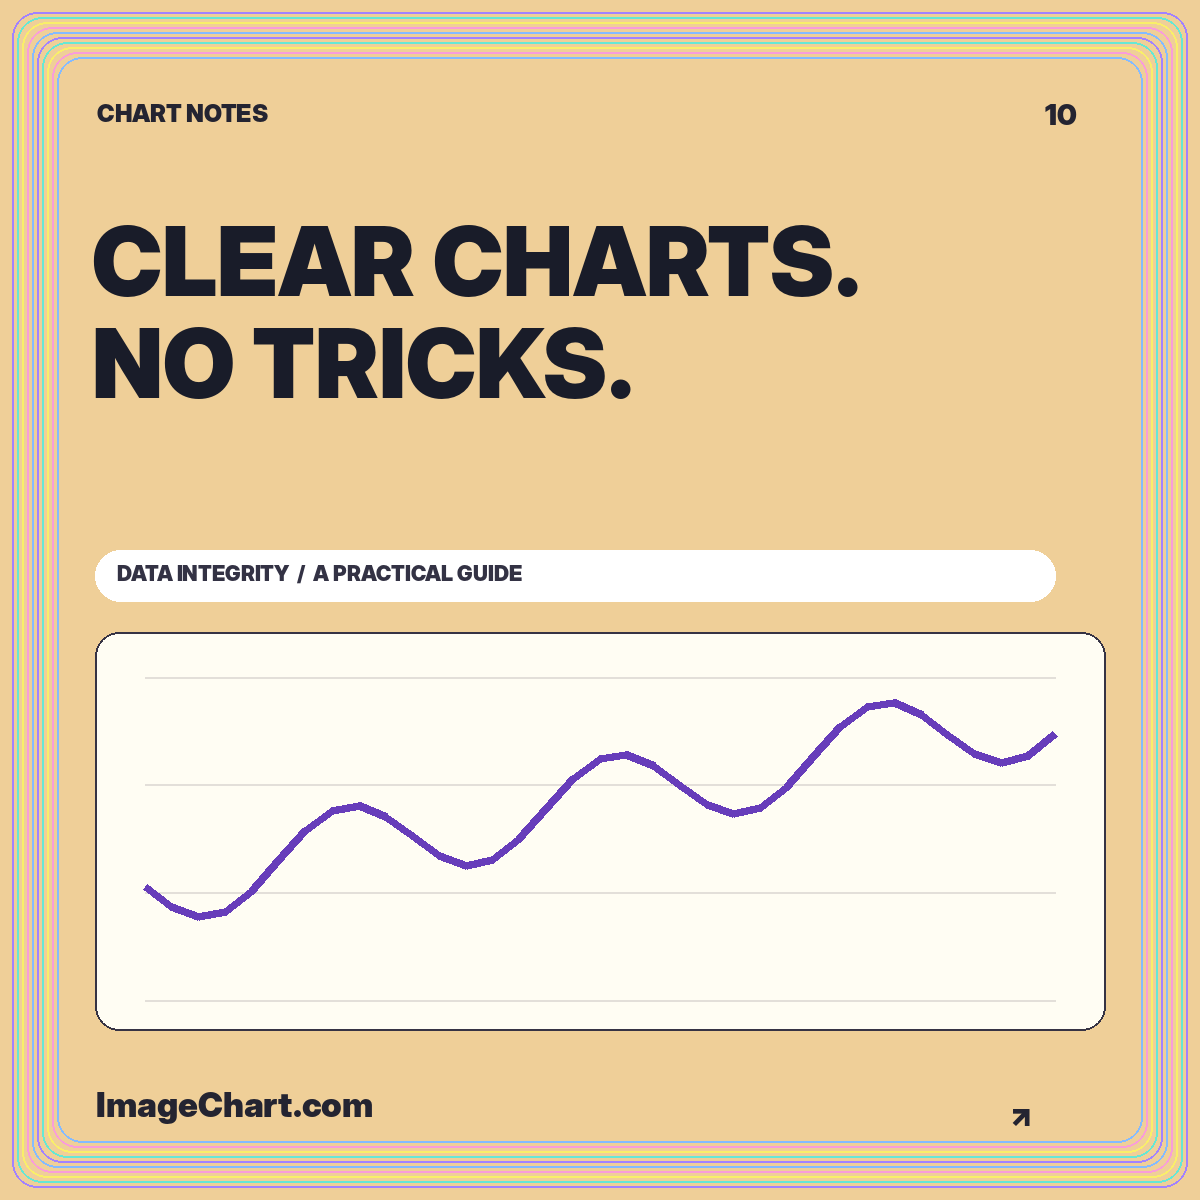
Audit your headline, scale, denominator, comparison window, color choices, and final export against the evidence actually displayed.
Read the guide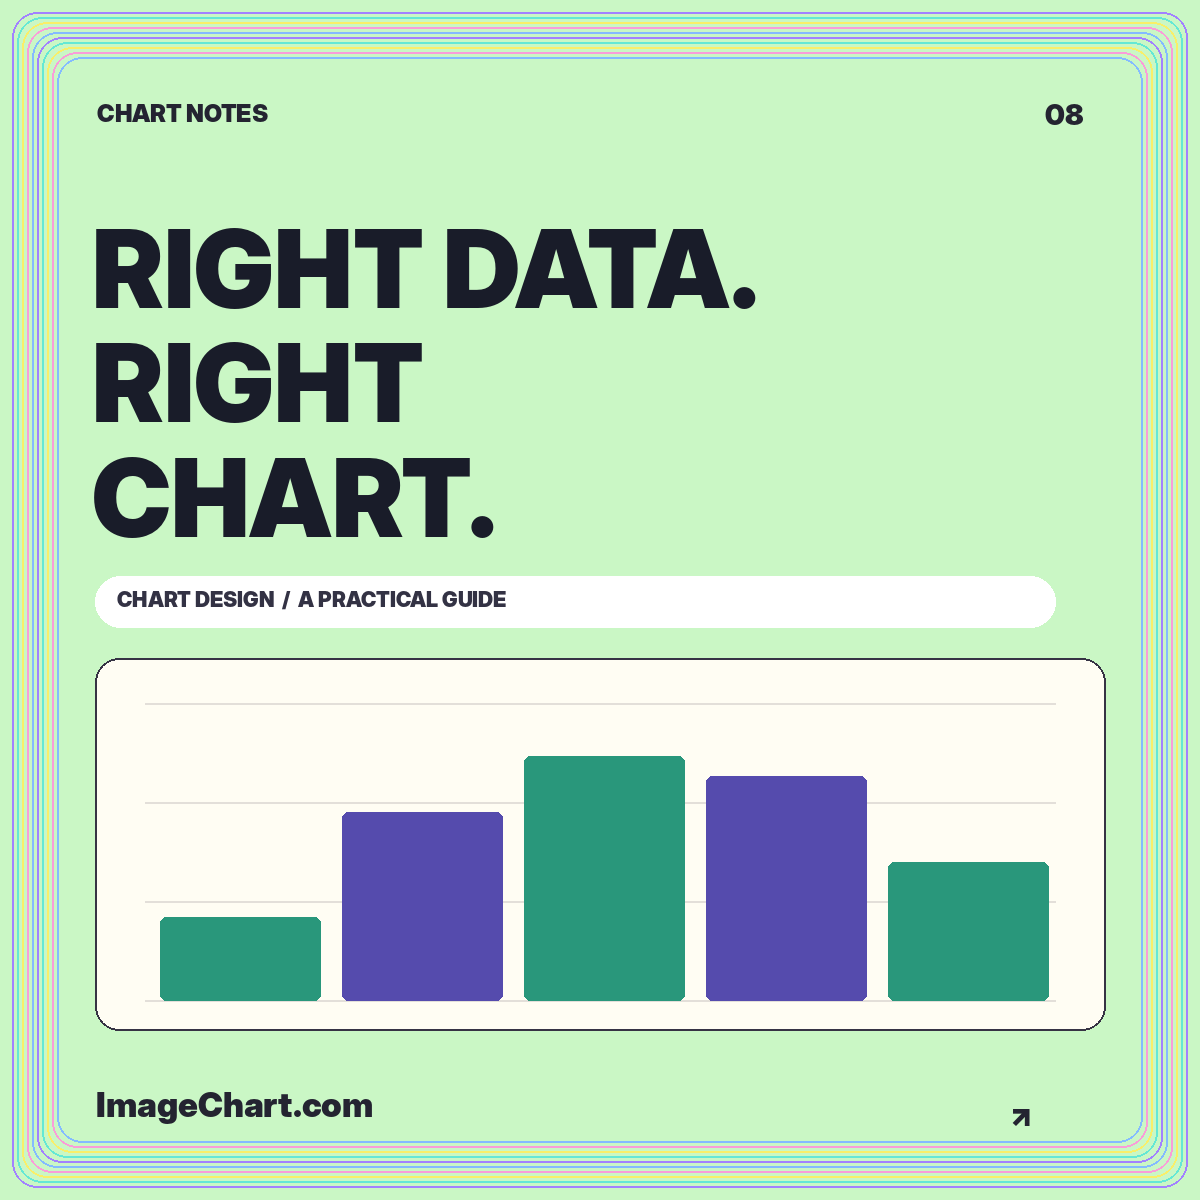
Match visual structure to the reading task, compare the same data in different formats, and avoid misleading connections or baselines.
Read the guideThis edition does not include uploads or data-entry forms. The studio explores curated sample datasets. Download editable SVGs and source CSVs, or adapt the included code for your own verified data.
No. A PNG is a snapshot. All examples on this site use synthetic data, and that label remains inside the exported image.
Use PNG where you need a fixed-size image. Use SVG where the destination supports scalable vector artwork. Test the imported result in the software where it will be published.