Chart mistakes that change the story—and how to catch them
Audit your headline, scale, denominator, comparison window, color choices, and final export against the evidence actually displayed.
Read the guideTen complete guides to reading charts, explaining numbers, and publishing visuals with their context intact. Clear examples. Real calculations. No invented market results.
Showing 10 guides
Audit your headline, scale, denominator, comparison window, color choices, and final export against the evidence actually displayed.
Read the guide
Pair visual clarity with useful descriptions, readable tables, keyboard controls, and exports that keep essential information intact.
Read the guide
Match visual structure to the reading task, compare the same data in different formats, and avoid misleading connections or baselines.
Read the guide
Build a focused visual argument with a defensible headline, compatible chart, precise annotation, and context that survives the export.
Read the guide
Use worked examples to distinguish financial measures and create comparisons that preserve their units, denominators, and limitations.
Read the guide
Read activity units, compare completed intervals, calculate a baseline, and avoid turning a tall volume bar into an unsupported story.
Read the guide
Give overlays, volume, and momentum measures separate jobs, document the settings, and keep historical summaries distinct from forecasts.
Read the guide
Work through a five-session simple moving average, warm-up values, smoothing, lag, and the settings a useful legend should preserve.
Read the guide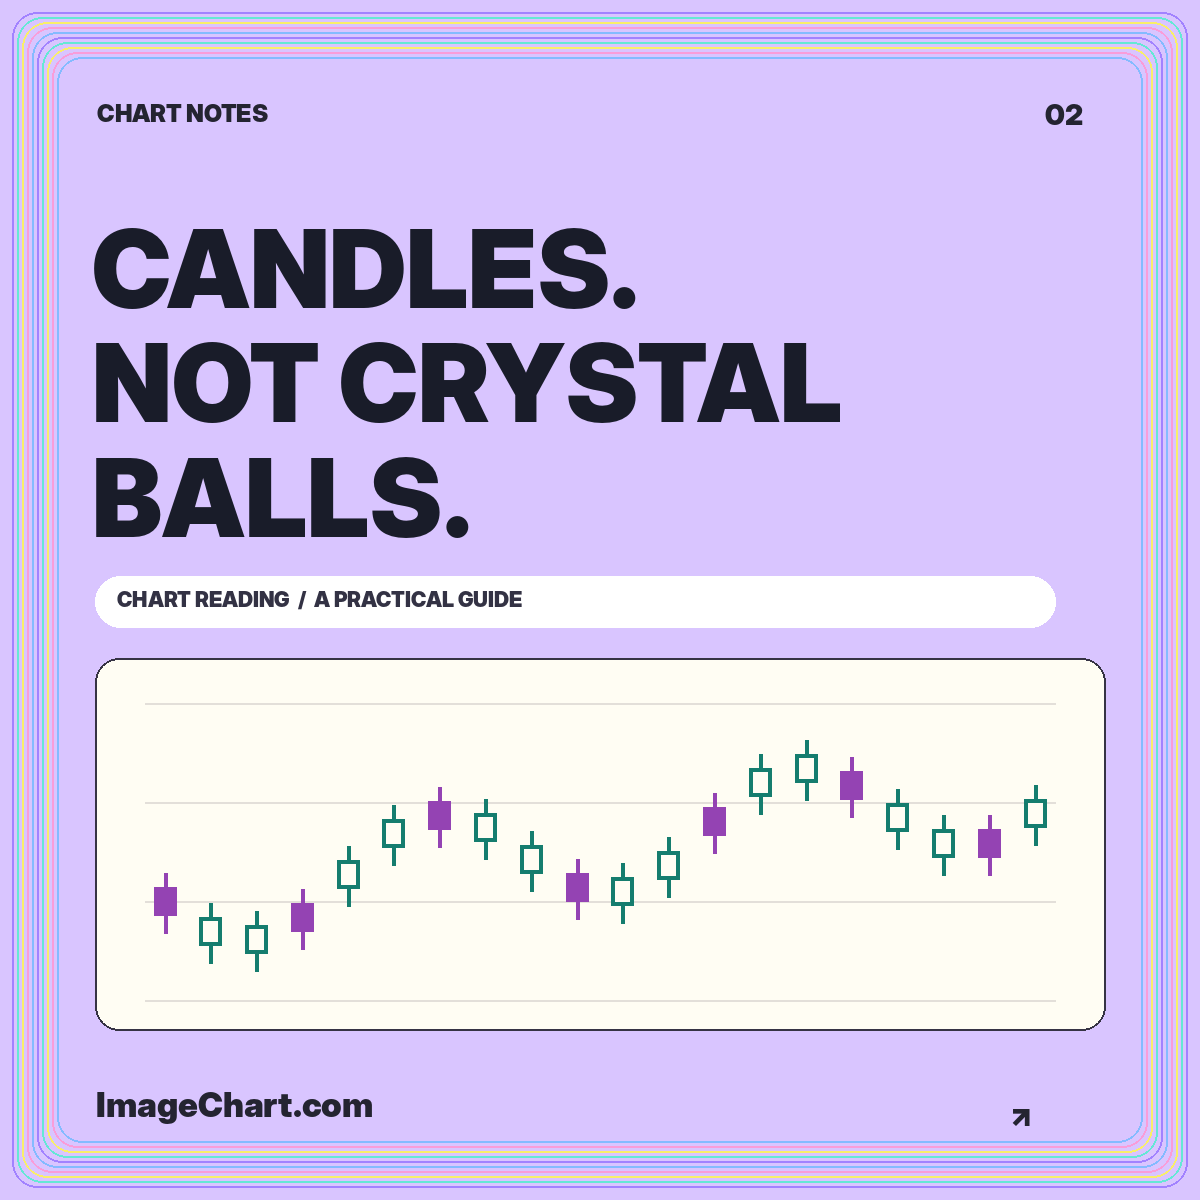
Reconstruct open, high, low, and close, understand fill conventions, and distinguish a descriptive candle pattern from a prediction.
Read the guide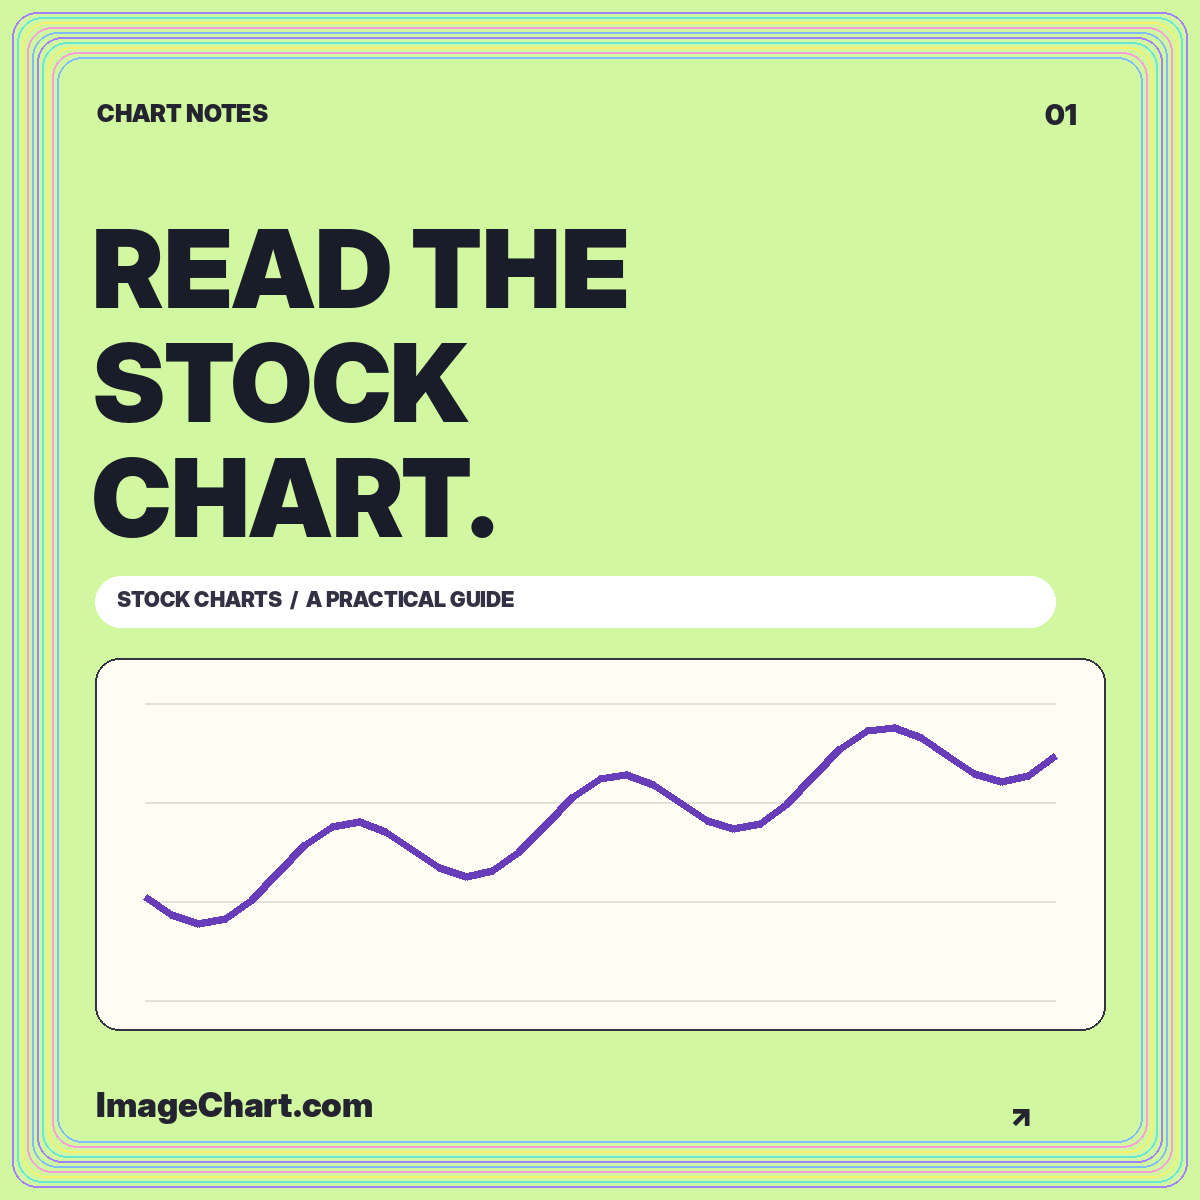
Learn a repeatable approach to chart identity, intervals, scales, price changes, and the difference between a visible pattern and an explanation.
Read the guide