Technical analysis charts: a clearer layout, not more noise
Give overlays, volume, and momentum measures separate jobs, document the settings, and keep historical summaries distinct from forecasts.
Read the guideExplore moving averages, indicator terminology, and disciplined technical-analysis chart layouts without mistaking historical summaries for forecasts.
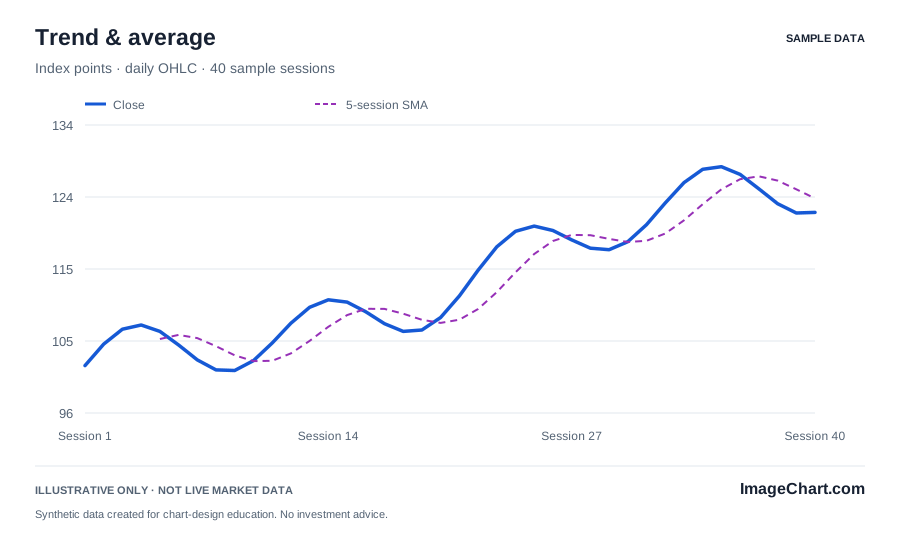
Start with what the display should help explain. A price-and-average view answers a different question from a volume panel. Add only the measures that contribute to that purpose. Multiple transformations of the same history do not automatically provide independent evidence, and additional lines can make a simple relationship harder to see.
State the method, input field, period count, and sampling interval. The studio’s overlay is a five-session simple moving average of the synthetic closing index. It is calculated from the full sample history before a display window is applied. The first four observations have no complete five-session result and remain unavailable.
Price overlays share a compatible unit with the main series. Measures such as volume or a percentage oscillator need their own scale. Keep those axes labeled and align time intervals across related panels. The glossary explains RSI, MACD, and other terminology; this studio renders the documented SMA, volume, and drawdown examples rather than claiming a full trading platform.
A crossing, range, or local high is a descriptive relationship. Its existence alone does not establish a suitable trade or future price direction. Make annotation rules explicit and avoid presenting a selected historical example as a performance study. A clean chart can teach a definition while acknowledging what it leaves unknown.
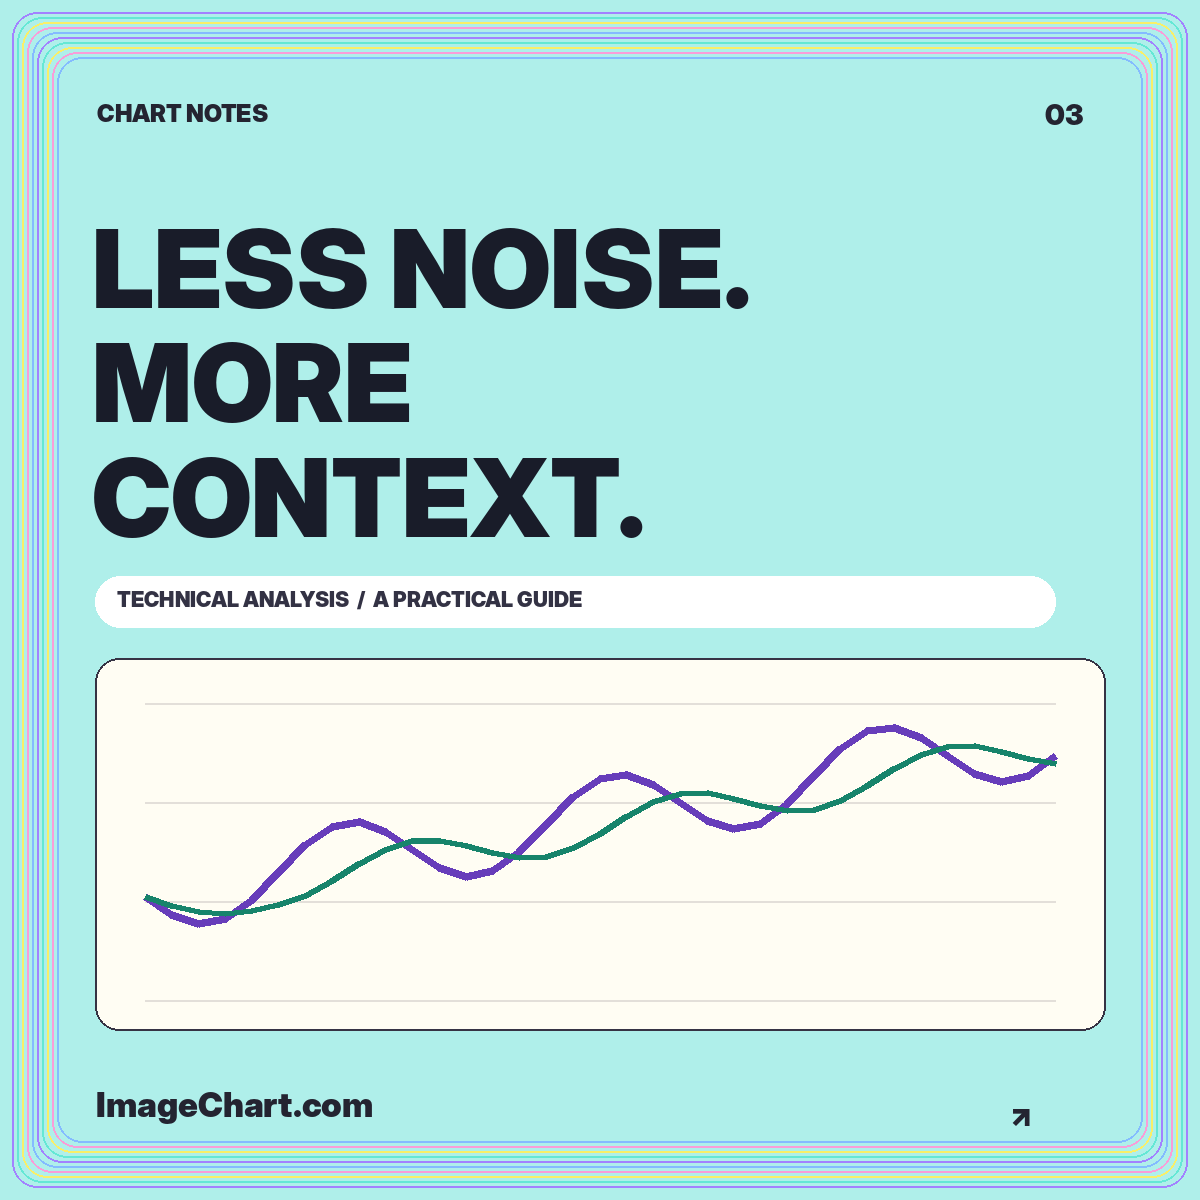
Give overlays, volume, and momentum measures separate jobs, document the settings, and keep historical summaries distinct from forecasts.
Read the guide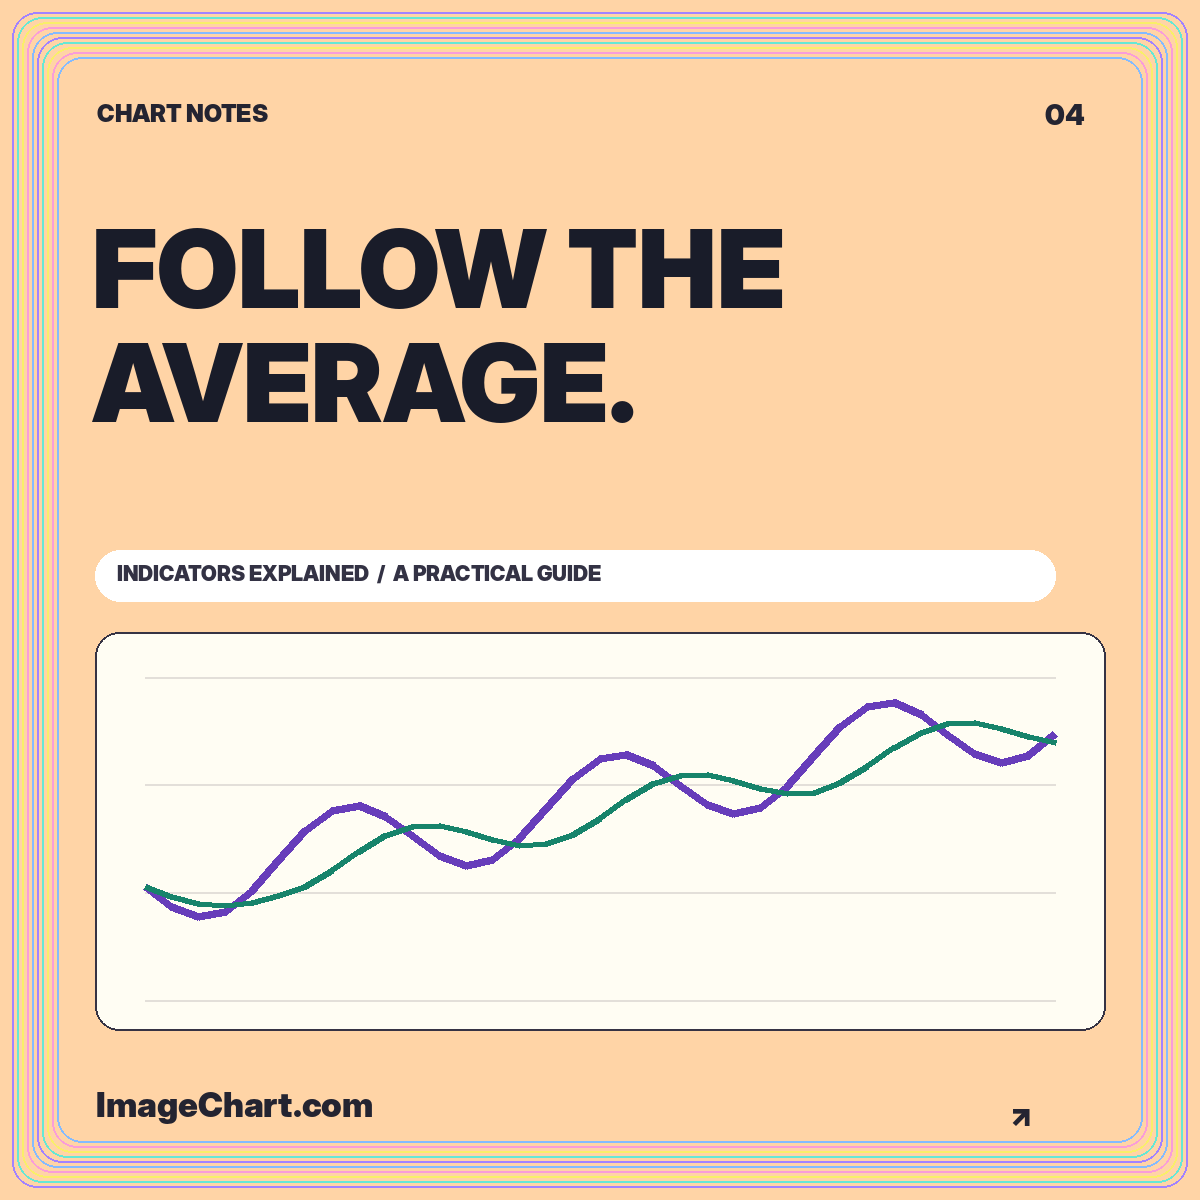
Work through a five-session simple moving average, warm-up values, smoothing, lag, and the settings a useful legend should preserve.
Read the guide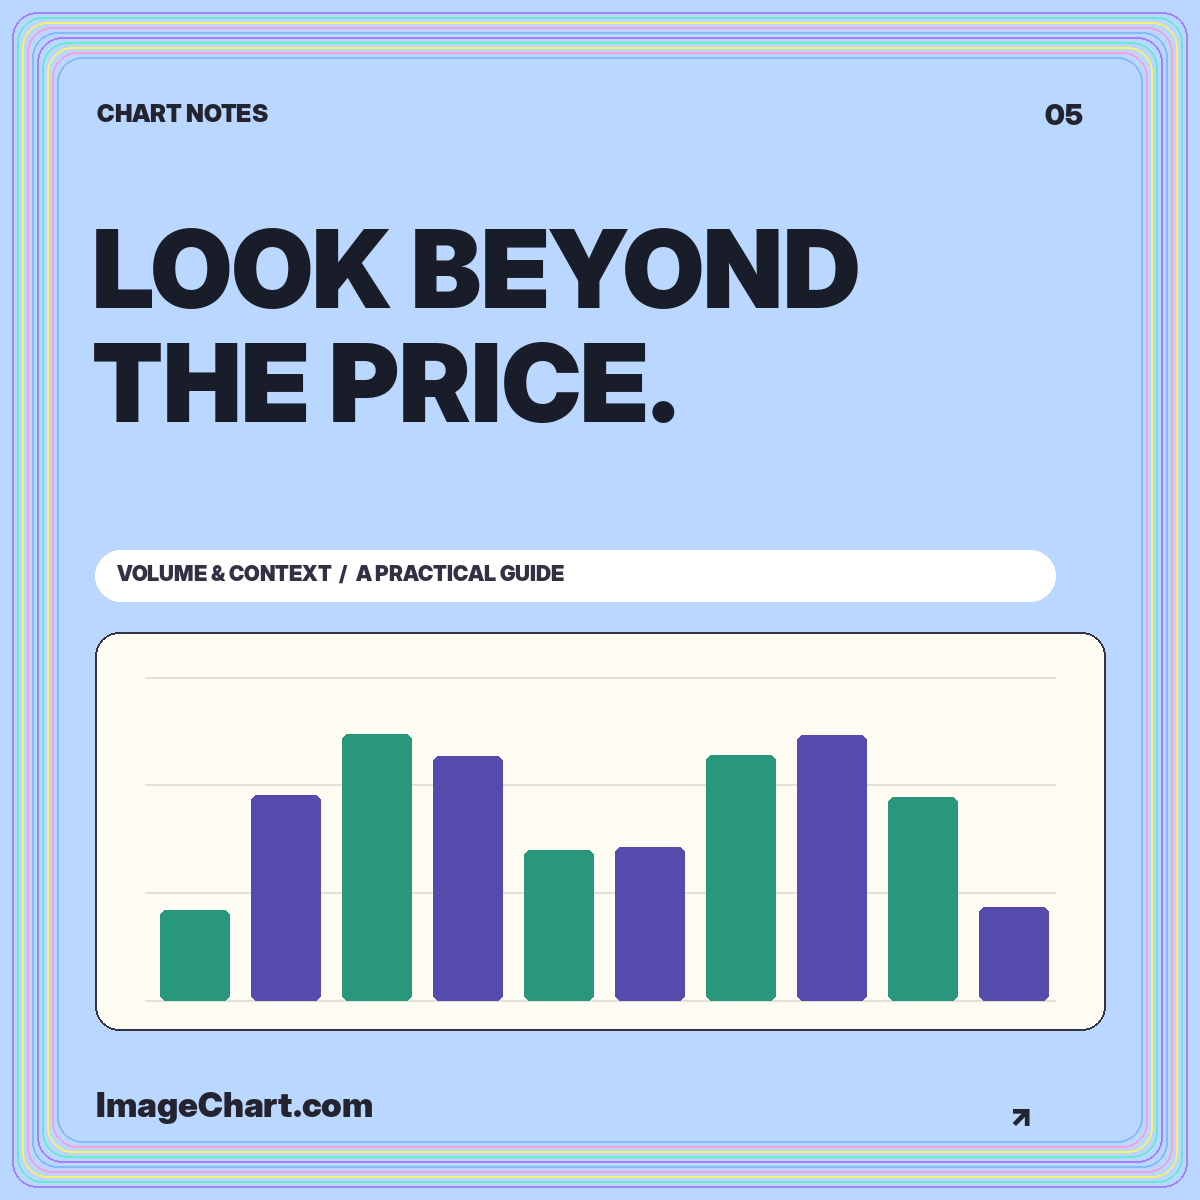
Read activity units, compare completed intervals, calculate a baseline, and avoid turning a tall volume bar into an unsupported story.
Read the guideThe market view includes a toggleable five-session SMA. Separate datasets show synthetic volume and a running-peak drawdown calculation. RSI and MACD are explained in the glossary, not offered as live calculated tools.
The average is calculated from the full forty-session sample first. A ten- or twenty-session view changes the display crop, not the earlier calculation history.
They are educational historical summaries. No trade execution, brokerage connection, performance promise, or personal recommendation is included.