Infographic chart design: one chart, one clear story
Build a focused visual argument with a defensible headline, compatible chart, precise annotation, and context that survives the export.
Read the guideCreate a clear reading path from headline to evidence to takeaway. Explore visual-story formats designed for articles, reports, and social sharing.
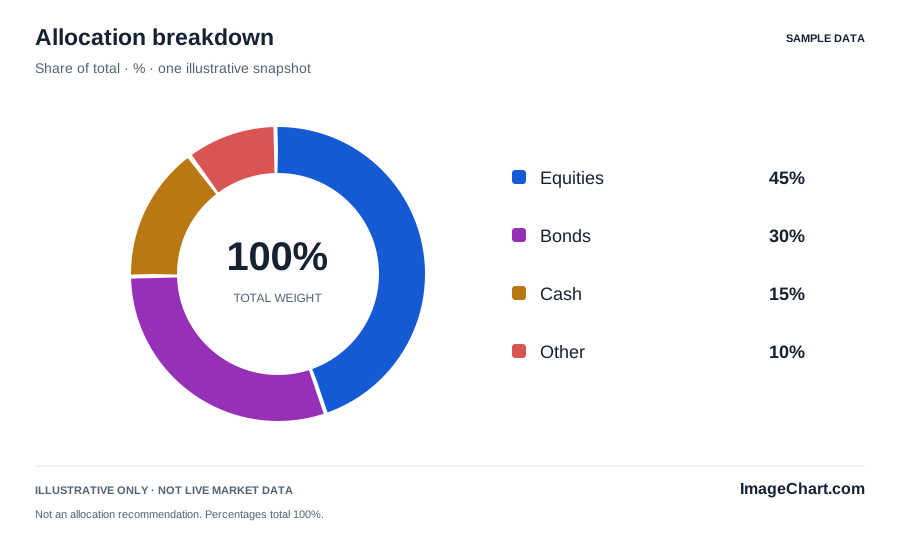
A useful infographic arranges a focused message, its supporting data, and the context needed to interpret it. Start with the underlying comparison and keep your wording descriptive. An explanation can be engaging without implying that a chart proves a motive, a causal mechanism, or a future outcome.
Use spacing, type hierarchy, and a limited set of visual treatments to guide reading. A strong headline should not crowd the data. An annotation should not cover the point it explains. Bright accents and rounded panels can make a layout approachable while the plot itself remains precise, quiet, and readable.
A square editorial card introduces a topic; a wide chart figure carries the data; webpage text provides the detailed explanation. Let these formats complement one another instead of cramming the whole article into a single image. Preserve a consistent subject, period, source note, and example-data status across every version.
Use a concise image description and real supporting text. Offer a table when exact values matter. Distinguish categories with labels and patterns, not only hue. An infographic becomes more useful when readers can choose whether to scan the visual, read the explanation, or inspect the numbers directly.
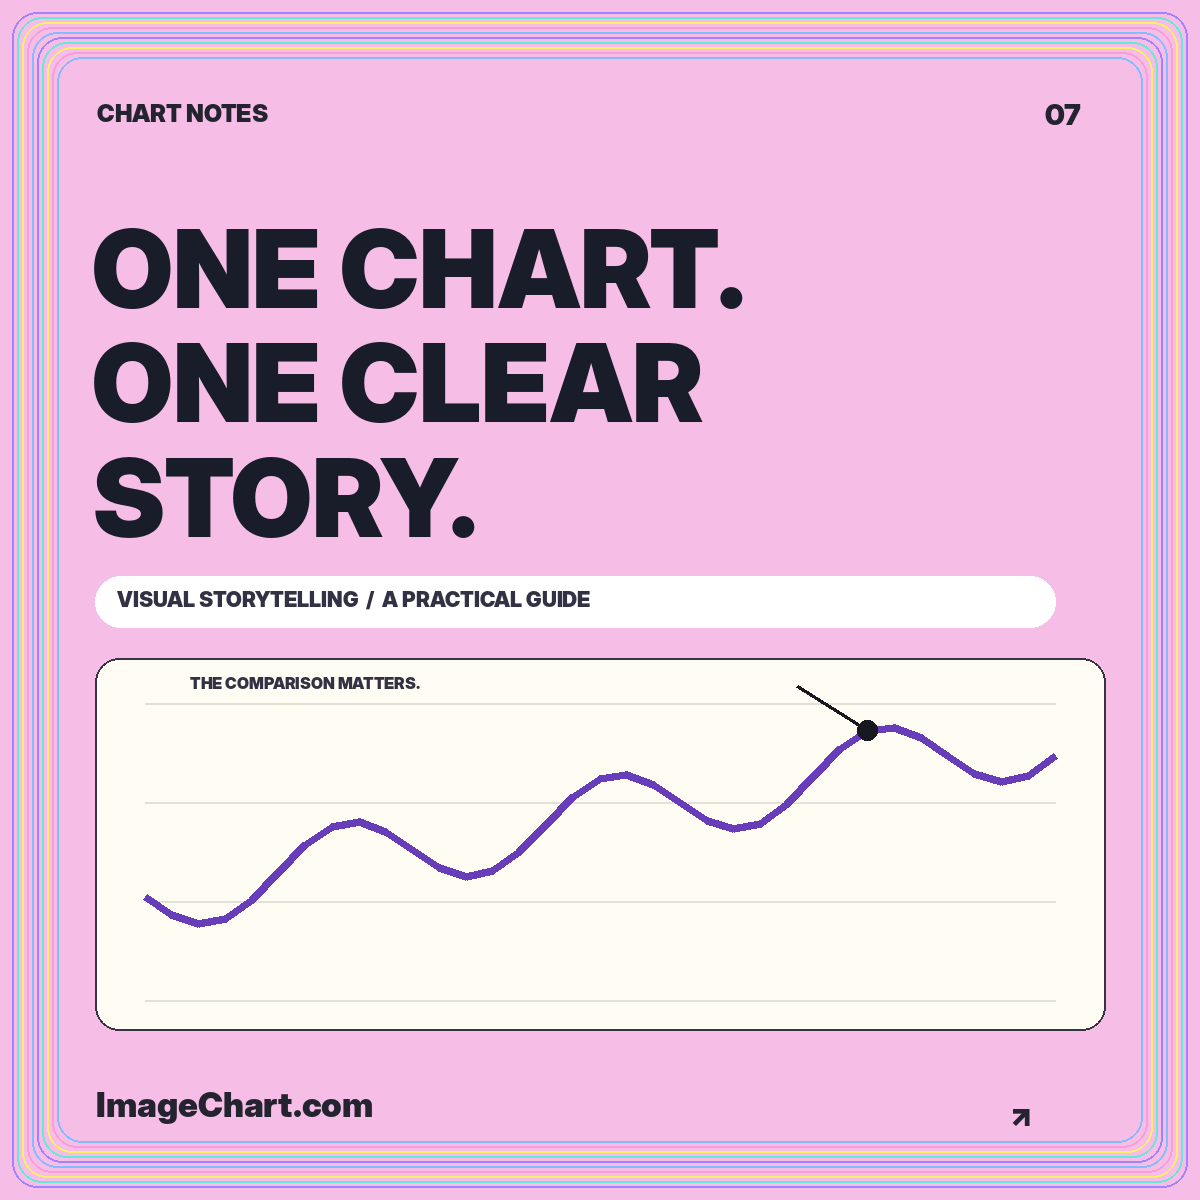
Build a focused visual argument with a defensible headline, compatible chart, precise annotation, and context that survives the export.
Read the guide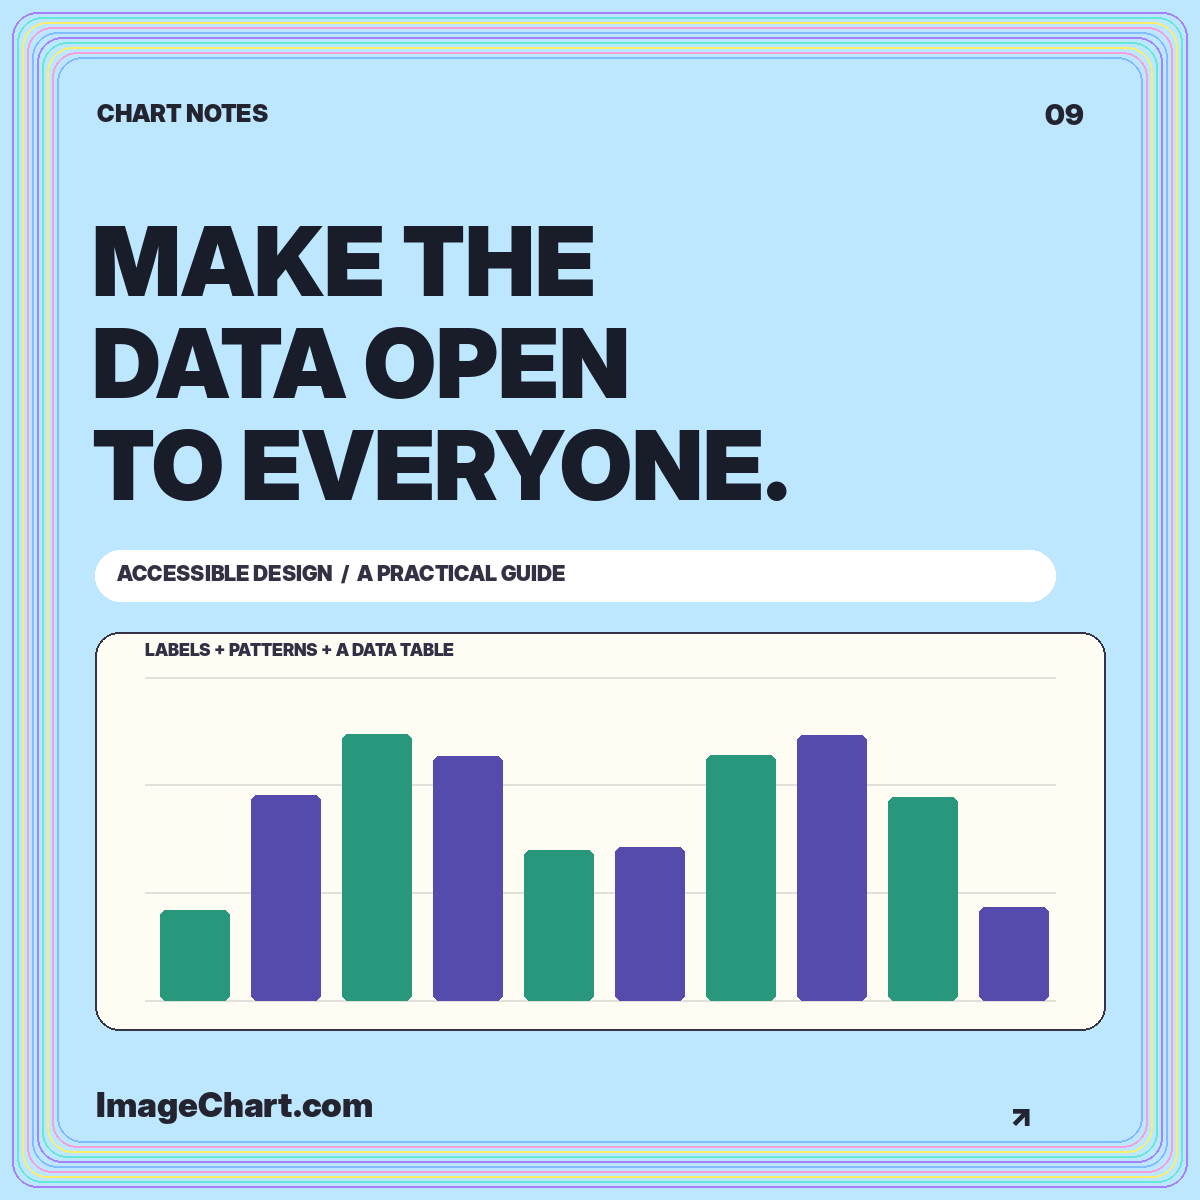
Pair visual clarity with useful descriptions, readable tables, keyboard controls, and exports that keep essential information intact.
Read the guide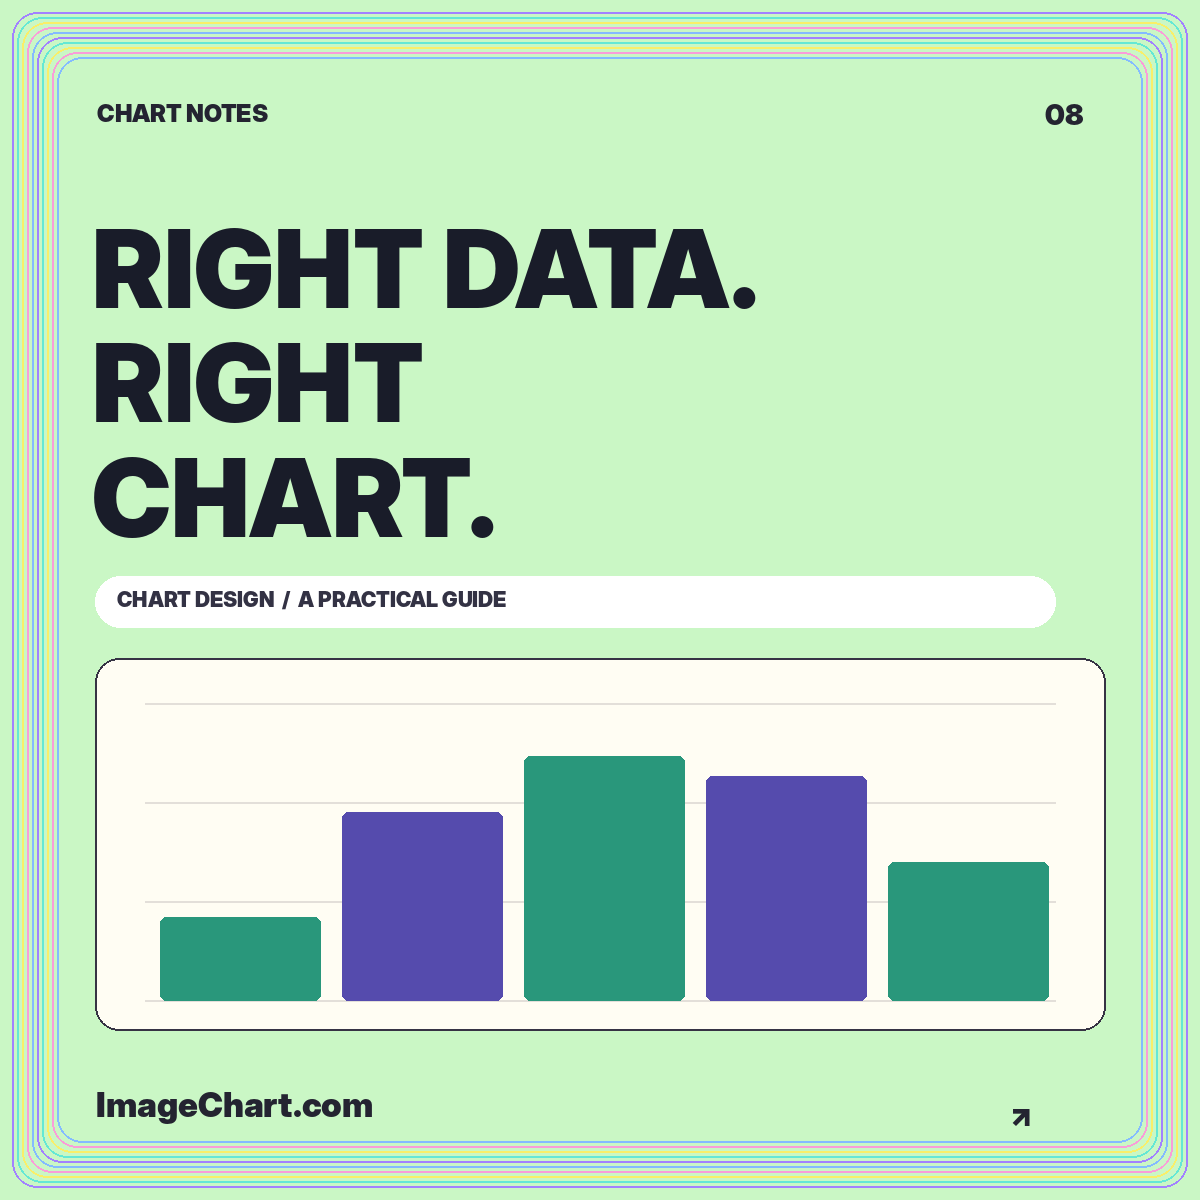
Match visual structure to the reading task, compare the same data in different formats, and avoid misleading connections or baselines.
Read the guideThe original ImageChart example layouts are provided for adaptation. Preserve their illustrative-data label when using the sample values, and check the rights to any data or third-party material you add.
No. Use a focused headline, one meaningful visual, and concise context. Keep detailed discussion and data in accessible webpage text or an accompanying document.
Choose a template whose comparison matches your subject, read its source data, and review the infographic design guide before adapting the layout.