Finance graphs: returns, drawdowns, revenue, and allocation
Use worked examples to distinguish financial measures and create comparisons that preserve their units, denominators, and limitations.
Read the guideExplain revenue, allocation, indexed values, and drawdowns with finance graphs that make their units and assumptions visible.
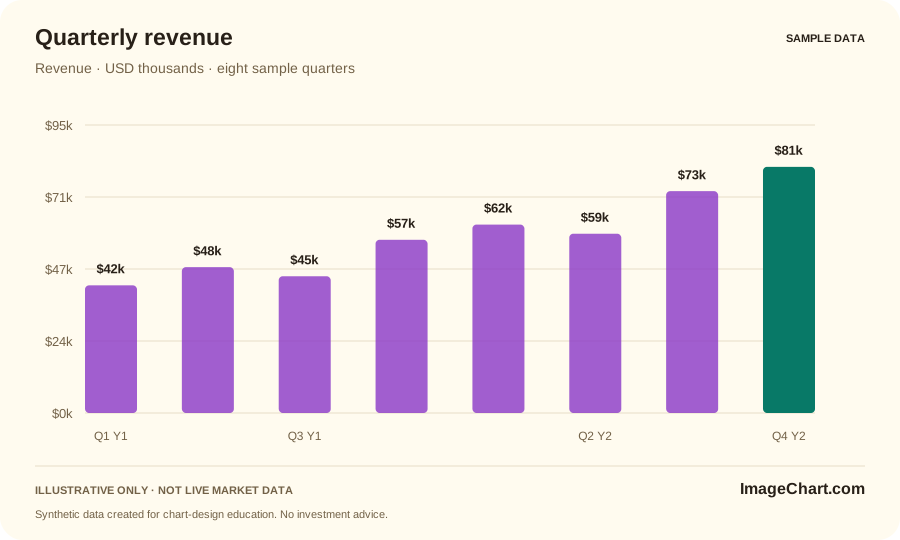
Revenue measures a period. An account balance measures an amount at a point in time. An investment return needs a defined methodology. Those quantities may share a familiar visual shape without being comparable. Name the exact measure in the title or subtitle instead of letting a currency symbol do all the explanatory work.
Check the unit, period, currency, coverage, and aggregation before comparing series. Rebasing a value to an index of 100 can make relative movement visible, but it does not make different definitions equivalent. A balance increase can include deposits; a price-only change need not represent total return. Make the relevant distinction explicit.
A drawdown view measures the selected series below its running peak under a specified calculation. It can reveal part of the path that an endpoint percentage hides. Our illustrative drawdown uses synthetic closes and retains the peak from the full sample history before display filtering. It is not an account record or a comprehensive risk assessment.
An allocation chart needs compatible categories and a defined total. The sample weights of 45%, 30%, 15%, and 10% add to 100%, and can be viewed as bars or a donut. These are arbitrary teaching values, not a recommended portfolio. Direct labels and a supporting table make the same snapshot available in several forms.
Use worked examples to distinguish financial measures and create comparisons that preserve their units, denominators, and limitations.
Read the guide
Audit your headline, scale, denominator, comparison window, color choices, and final export against the evidence actually displayed.
Read the guide
Learn a repeatable approach to chart identity, intervals, scales, price changes, and the difference between a visible pattern and an explanation.
Read the guideNo. They are arbitrary, clearly labeled weights used to demonstrate a part-to-whole chart. They do not reflect a personal financial situation or investment objective.
Each synthetic close is divided by the running maximum close through that session, minus one, then multiplied by 100. The displayed series is therefore zero at new closing highs and negative below them.
No. Eight fictional quarters are labeled Q1–Q4 in example years Y1 and Y2. Values are shown in USD thousands solely for visualization practice.