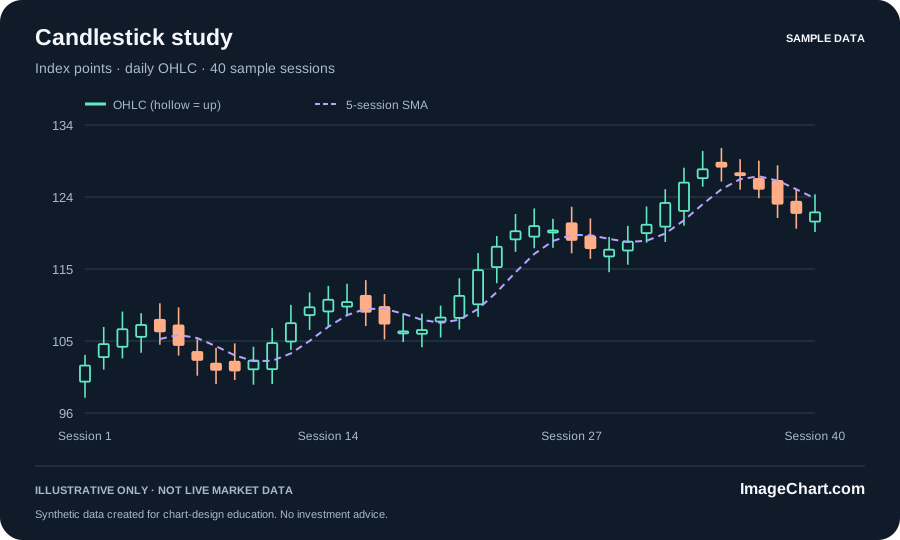
How to read stock charts without losing the context
Learn a repeatable approach to chart identity, intervals, scales, price changes, and the difference between a visible pattern and an explanation.
Read the guideStock charts. Finance graphs. Visual stories.
Explore beautifully clear charts, learn what they mean, and turn the right view into a shareable image.
For your next report, post, or big idea.
From a single image chart to a complete visual explanation. Start with the format that fits your story.
Crisp, self-contained visuals that keep their labels, context, and clarity.
Pair a focused chart with a headline, helpful callouts, and the full picture.
Readable price action, clean candles, and a better view of the whole story.
Give each indicator a clear purpose, a readable label, and the right scale.
Make revenue, allocations, and drawdowns understandable at a glance.
Turn an explanation into a visual story that travels with its context.
No account, no complex dashboard, no mystery data. Just a focused place to explore and export.
Explore market, revenue, allocation, volume, and drawdown examples. Every dataset is transparently illustrative.
Switch chart types, compare display windows, and choose a palette. Read the values in the companion data table.
Save an SVG, PNG, or CSV. Your exported chart keeps its title, units, and sample-data note wherever it goes.
A few useful starting points. Every layout includes a preview, editable SVG, PNG image, and source CSV.
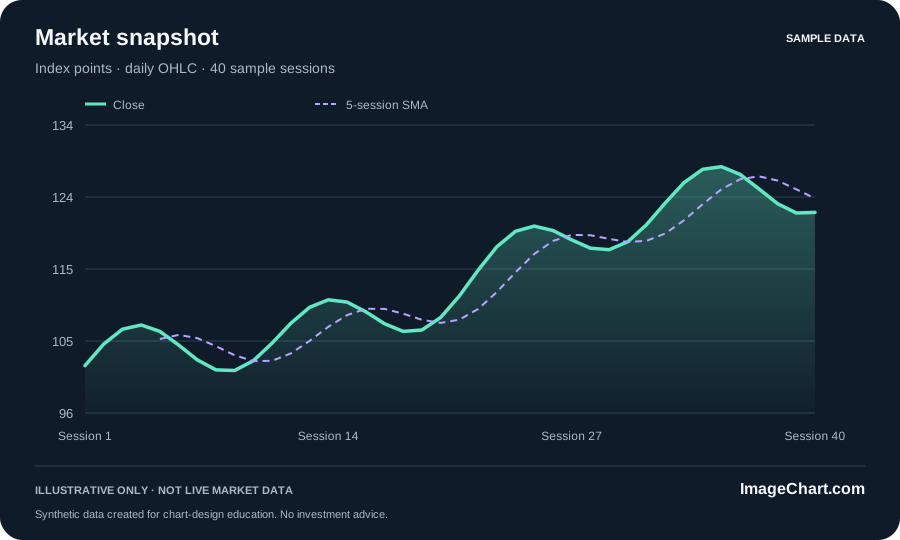
A price series with a moving-average overlay and a clearly labeled time window.
Explore template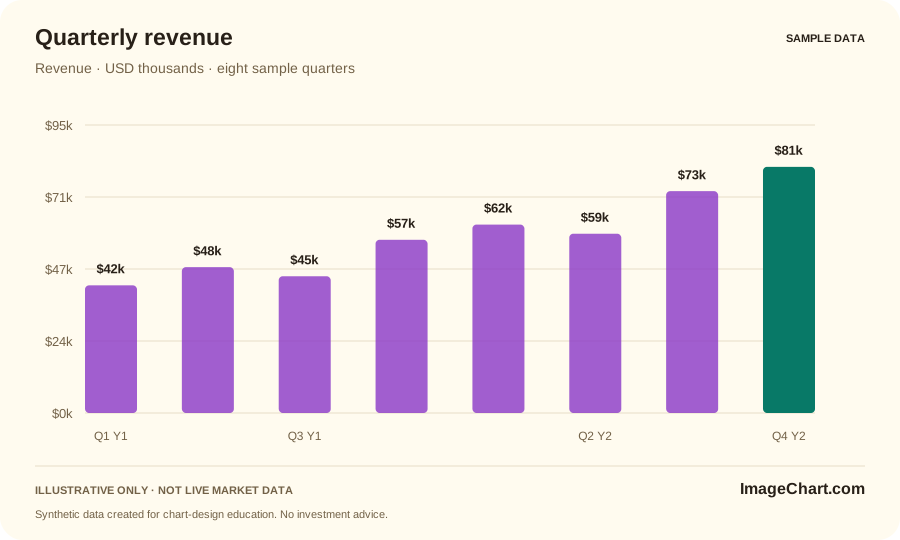
Compare eight sample quarters on a zero-based scale in USD thousands.
Explore template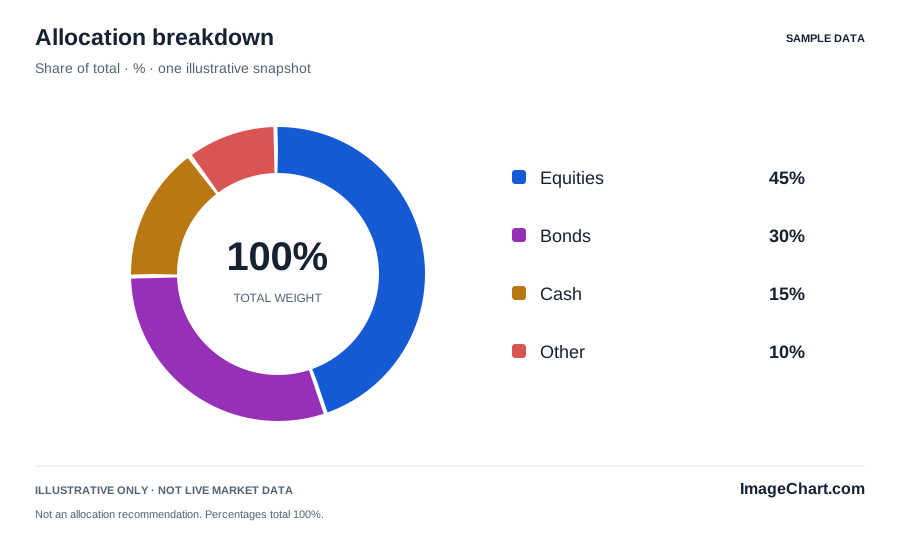
An illustrative four-part allocation that adds to 100%, with direct labels.
Explore templateOriginal guides to chart reading, visual storytelling, and the details that make a graphic worth trusting.
Learn a repeatable approach to chart identity, intervals, scales, price changes, and the difference between a visible pattern and an explanation.
Read the guide
Build a focused visual argument with a defensible headline, compatible chart, precise annotation, and context that survives the export.
Read the guide
Use worked examples to distinguish financial measures and create comparisons that preserve their units, denominators, and limitations.
Read the guideWhat the examples do, what the downloads include, and how to keep the context intact.
No. The charts use deterministic synthetic data for visualization education. There is no live quote feed, brokerage connection, or trade execution. Every example and image export is labeled accordingly.
The studio saves the selected view as SVG, PNG, or CSV. The template gallery includes nine ready-made chart sets, each with an SVG, an 1800 × 1080 PNG, and its source data.
This static edition has no data-entry or upload forms. Explore the curated examples, then adapt the editable SVG or the supplied chart source for your own verified measurements.
No account or signup is required to read the guides, explore the sample studio, or download the files.
No. The values and allocations are illustrative. The guides explain chart interpretation and calculations, not personal recommendations or forecasts.
Keep its title, measure, period, and data-status note visible. Pair the image with a written description and the source values when readers need more detail.