Infographic chart design: one chart, one clear story
Build a focused visual argument with a defensible headline, compatible chart, precise annotation, and context that survives the export.
Read the guideBring a headline, a focused visualization, and the right context together in an infographic chart people can actually read.
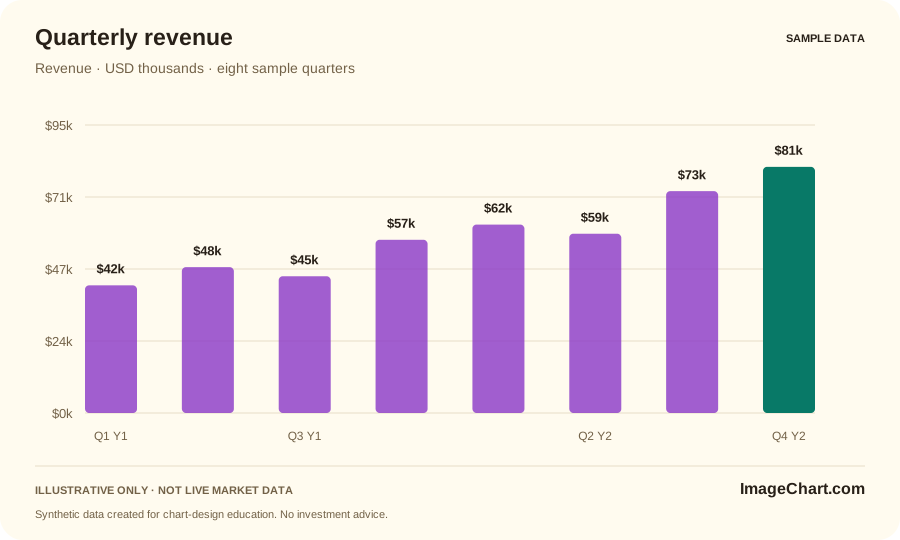
Write a sentence that the data can support. A descriptive comparison is a stronger foundation than a dramatic slogan. Decide which values are necessary to evaluate the sentence, then choose a visual form that places that comparison in view. Do not adjust the scale simply to make the claim look more impressive.
Use the title to identify the point, the plot to show the relationship, and a context line to define the measure. Keep units and periods visible. A short annotation can clarify an exception without turning the whole canvas into a wall of text. The headline and the evidence should remain consistent when the image is viewed alone.
Our template foundation uses bright surfaces, soft color washes, rounded cards, and a restrained chart canvas. Apply vivid color to distinguish meaning or guide attention, not to make every mark equally loud. Keep labels readable, distinguish lines with patterns when useful, and leave enough white space for the comparison to emerge.
A social card and a wide report graphic may need different compositions. Preserve the same measure, scale logic, period, and qualifications when reshaping the design. Never remove a necessary caveat just to fit a square crop. Pair the image with real webpage text and access to the values when readers need additional detail.
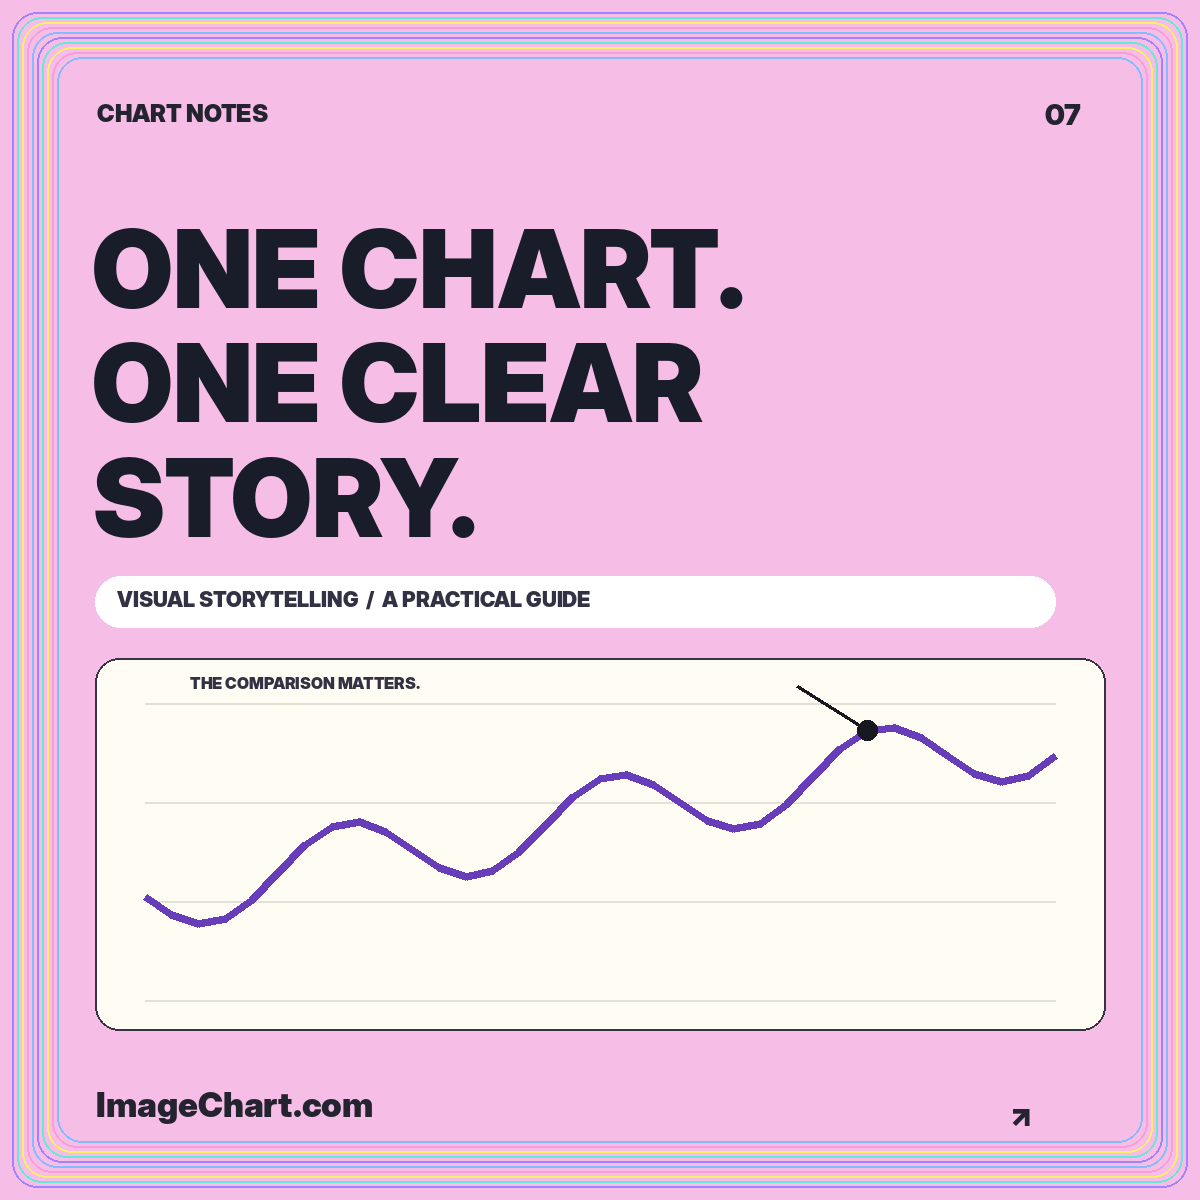
Build a focused visual argument with a defensible headline, compatible chart, precise annotation, and context that survives the export.
Read the guide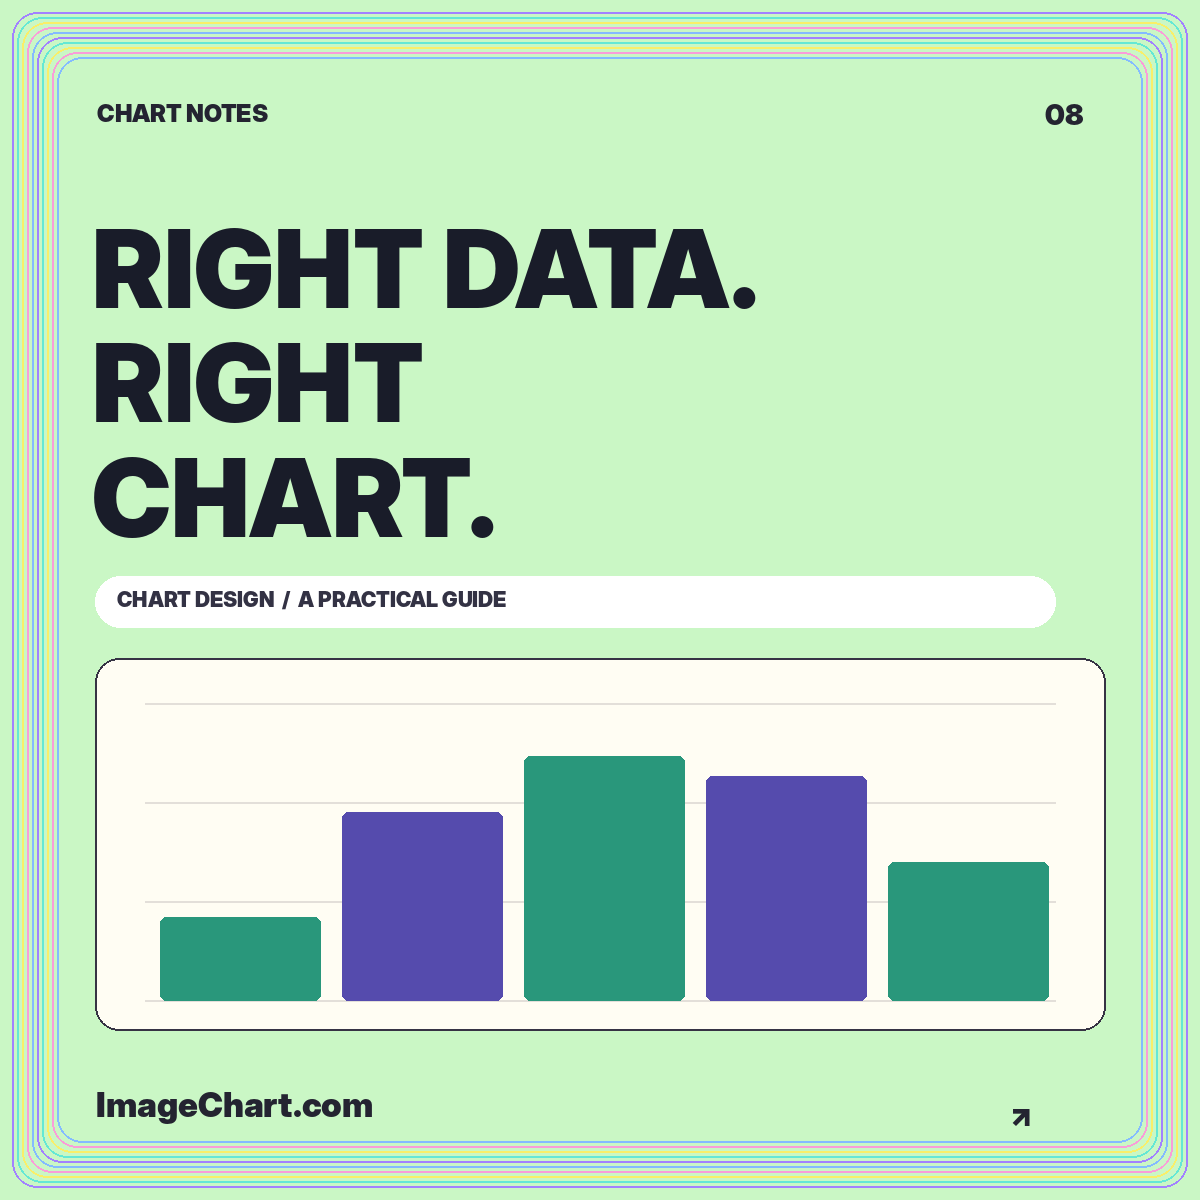
Match visual structure to the reading task, compare the same data in different formats, and avoid misleading connections or baselines.
Read the guide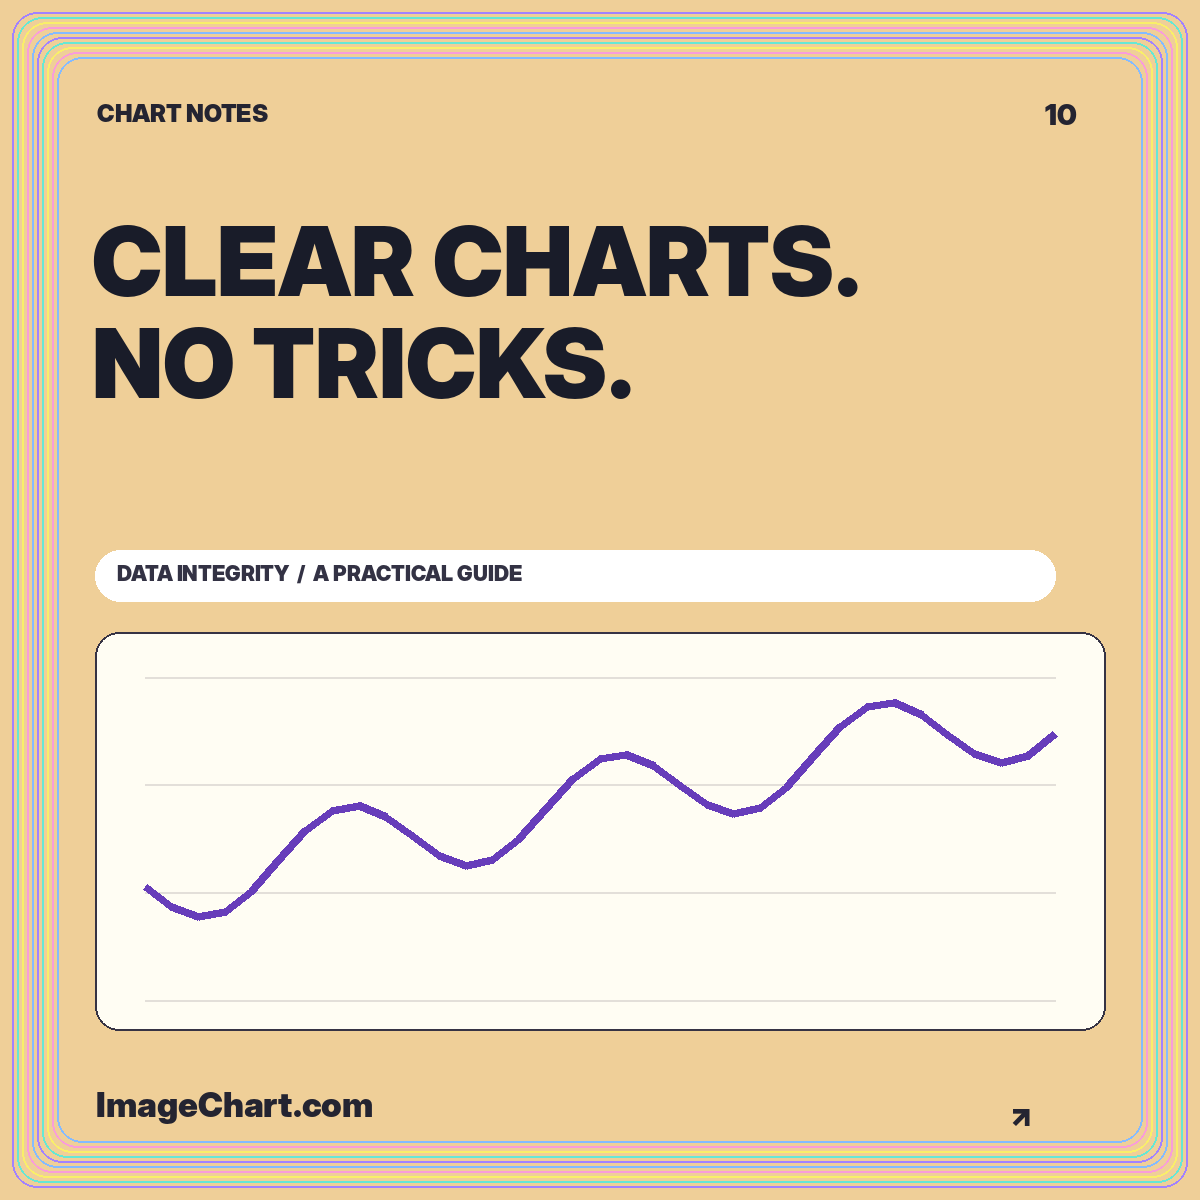
Audit your headline, scale, denominator, comparison window, color choices, and final export against the evidence actually displayed.
Read the guideAn infographic chart explains a focused comparison in a portable layout. A dashboard usually supports repeated exploration of several measures. A dashboard screenshot is not automatically a complete infographic.
Enough to identify the message, measure, period, and key limitation. Put the longer explanation and detailed table beside the image instead of shrinking them beyond readability.
No. The quarterly figures are invented for layout and calculation examples, and every downloadable graphic identifies them as illustrative.