How to read stock charts without losing the context
Learn a repeatable approach to chart identity, intervals, scales, price changes, and the difference between a visible pattern and an explanation.
Read the guideUnderstand price lines, candlesticks, volume, and chart scales through clear stock-chart guides and inspectable sample data.
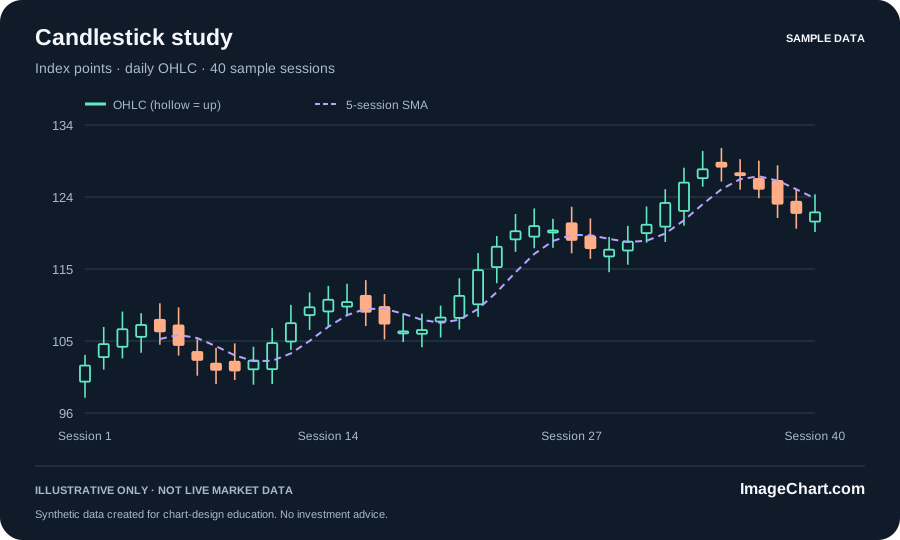
Start with the instrument, measure, unit, data source, observation interval, and timestamp. A daily candle and a weekly candle aggregate different intervals. A familiar ticker alone does not explain adjustment treatment or session coverage. The synthetic examples here use session numbers rather than real securities or claimed live quotes.
A close-price line isolates one selected value per interval. Candlesticks add open, high, and low around the close. Choose the level of detail that fits the question and final display size. A candle also needs a documented fill and color convention; open-to-close direction is not always the same as change from the previous close.
Equal distances on a linear axis represent equal absolute changes. A cropped price scale can help inspect detail, but it must be clear. Check the time window before drawing a broad conclusion from a steep-looking slope. Our examples label index points explicitly rather than presenting invented values as a dollar quote.
A volume panel or moving-average overlay can help describe a historical sequence. Neither turns a chart into a guarantee about the next observation. Separate the visible relationship from any causal explanation or investment decision. Read the worked guides before using a pattern name as a substitute for understanding its inputs.
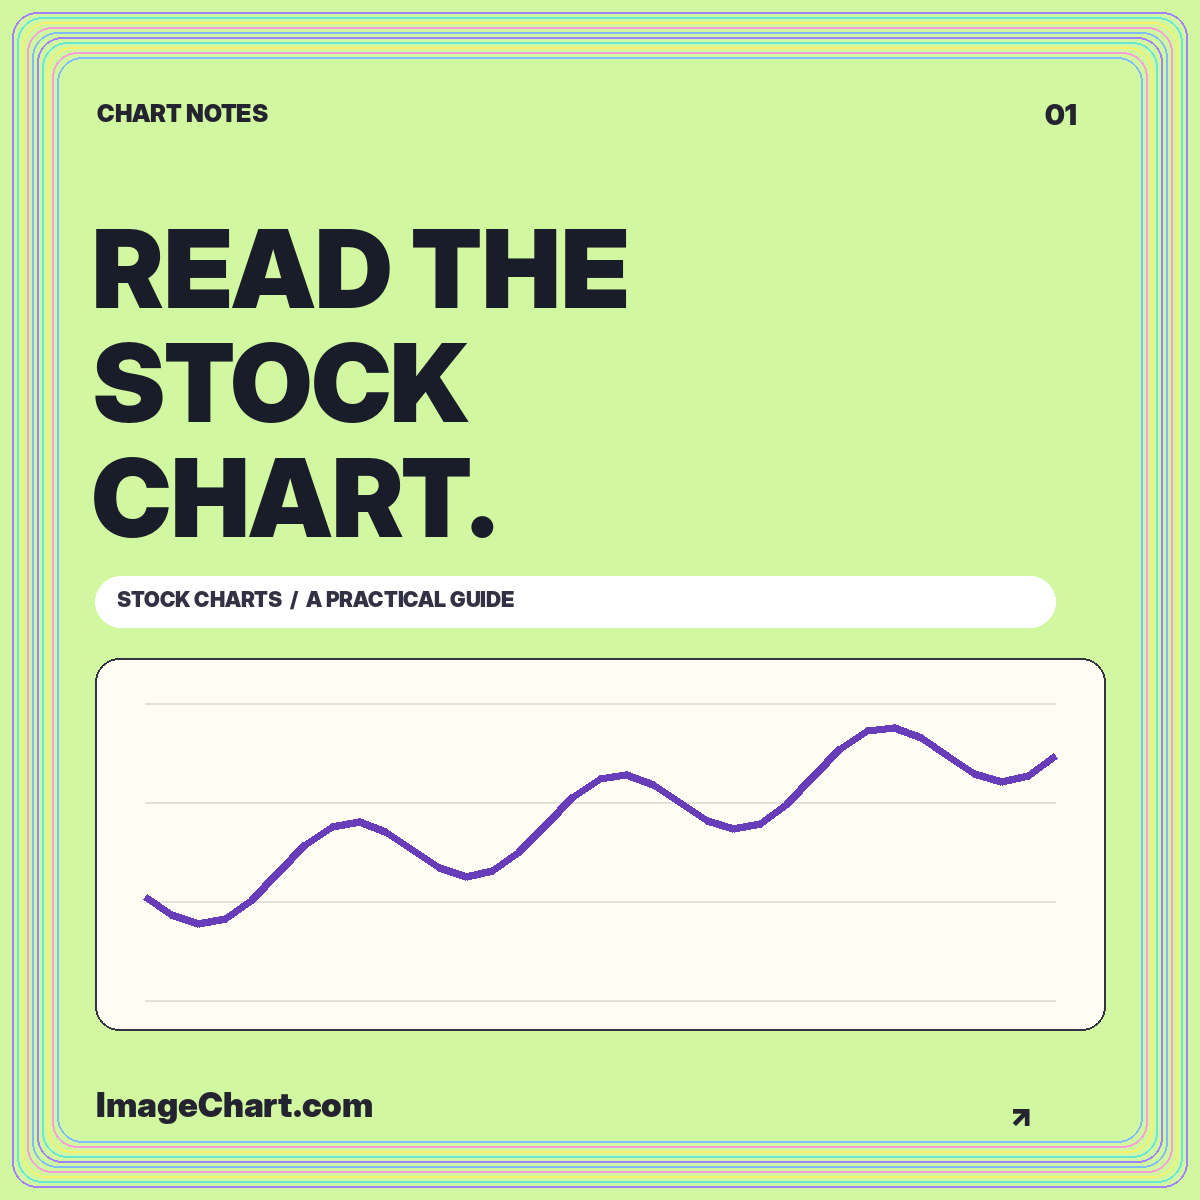
Learn a repeatable approach to chart identity, intervals, scales, price changes, and the difference between a visible pattern and an explanation.
Read the guide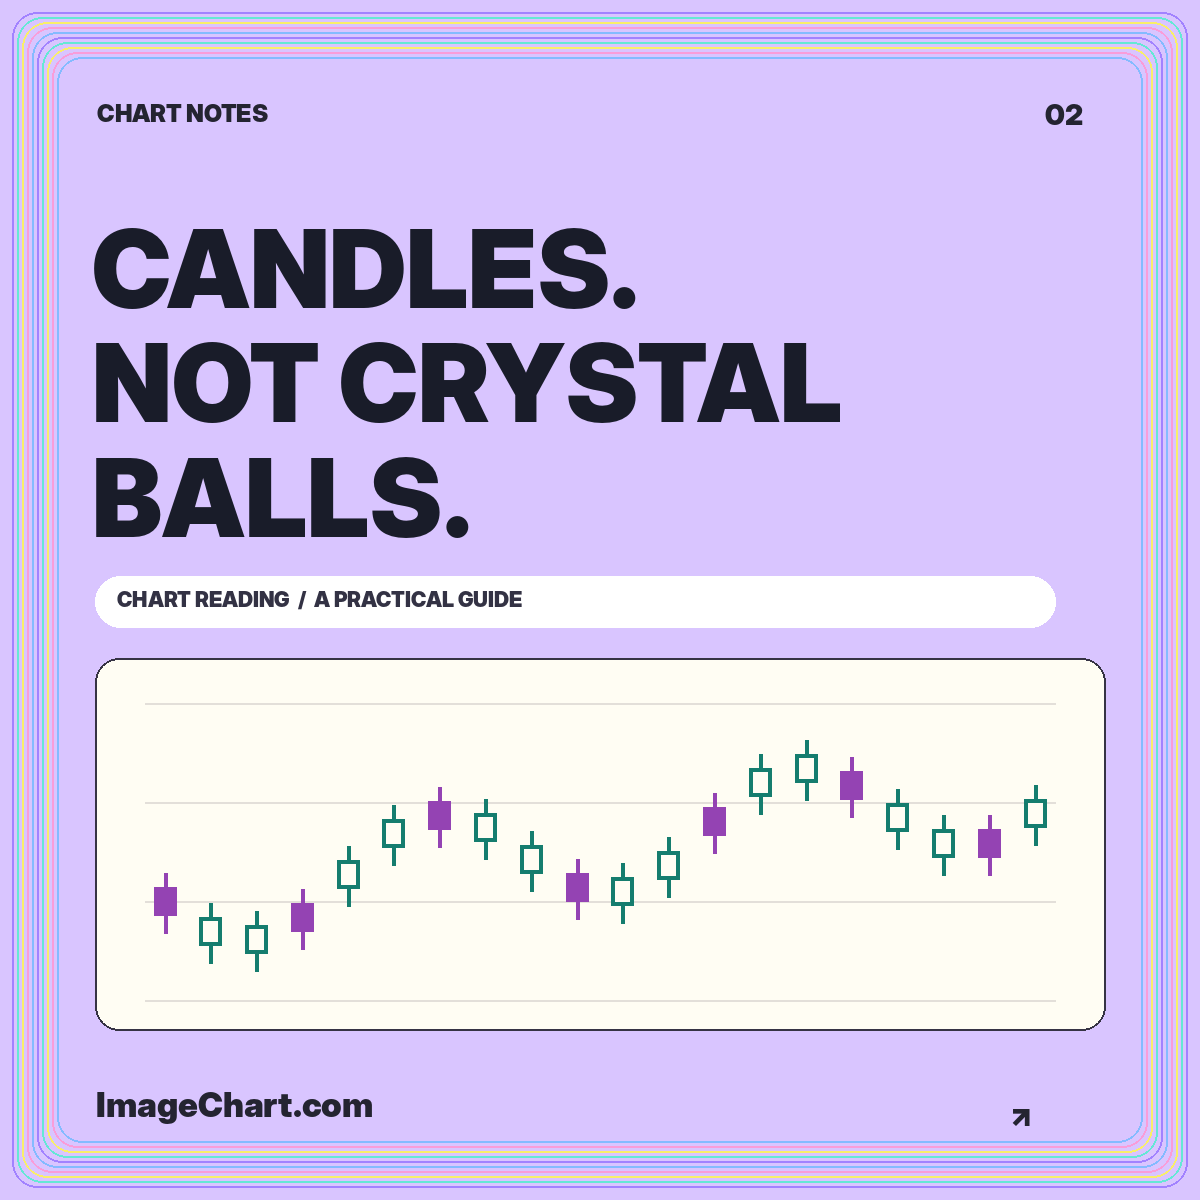
Reconstruct open, high, low, and close, understand fill conventions, and distinguish a descriptive candle pattern from a prediction.
Read the guide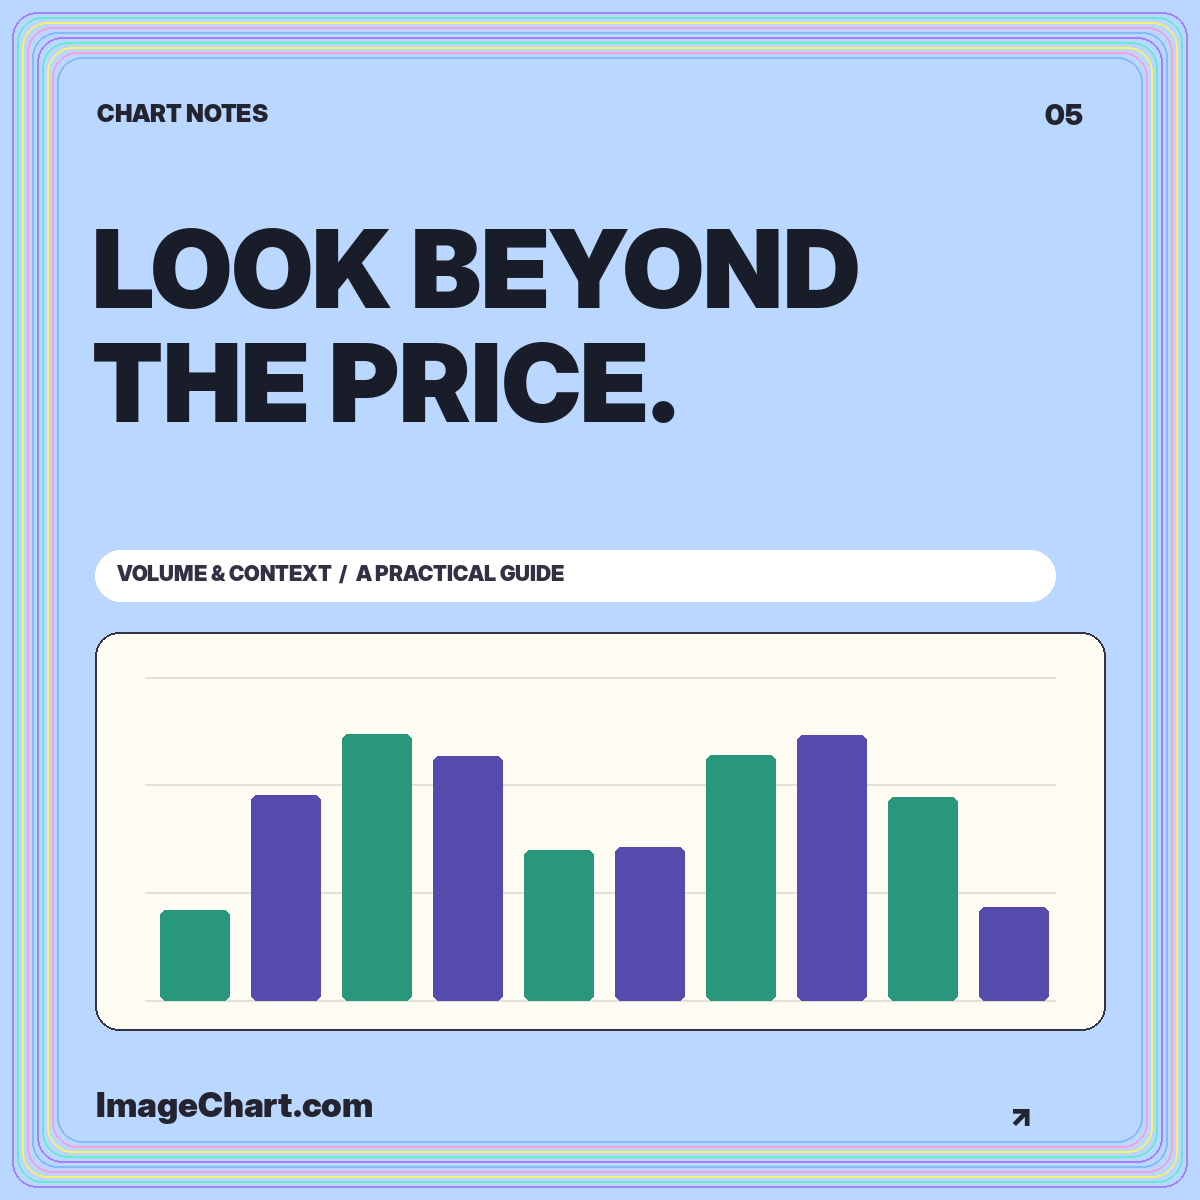
Read activity units, compare completed intervals, calculate a baseline, and avoid turning a tall volume bar into an unsupported story.
Read the guideNo. This site includes educational chart examples, not a connected market-data feed. Synthetic data is labeled in the interface, data files, and image exports.
Open, high, low, and close: four values summarizing a selected interval. A candle does not preserve every intermediate price or the order in which the high and low occurred.
These materials explain visual interpretation and calculations. They do not evaluate suitability, recommend a security, or promise a future result.