Candlestick study
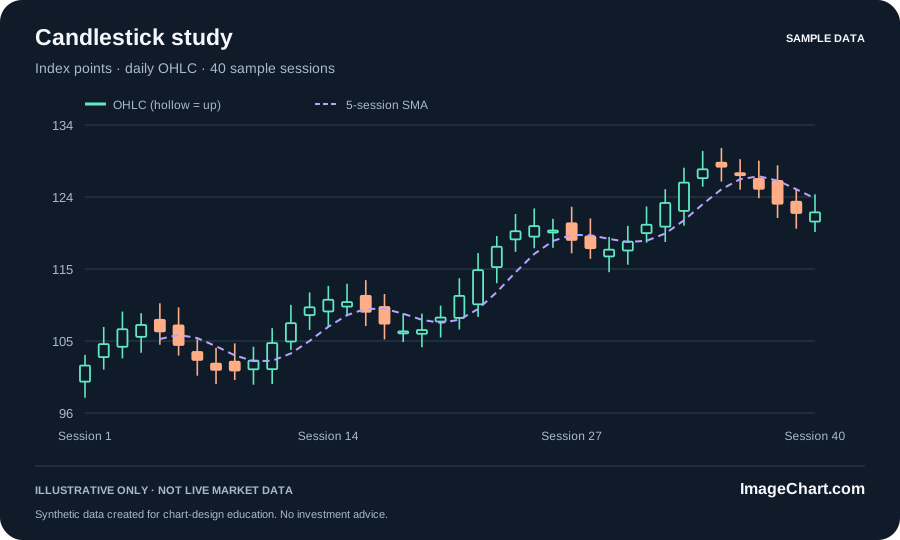
Open, high, low and close in one compact visual. Hollow candles distinguish up sessions.
One layout.
Three useful files.
Save the finished PNG, edit the vector SVG in compatible software, or inspect the exact source values in the CSV. All three files describe the same example.
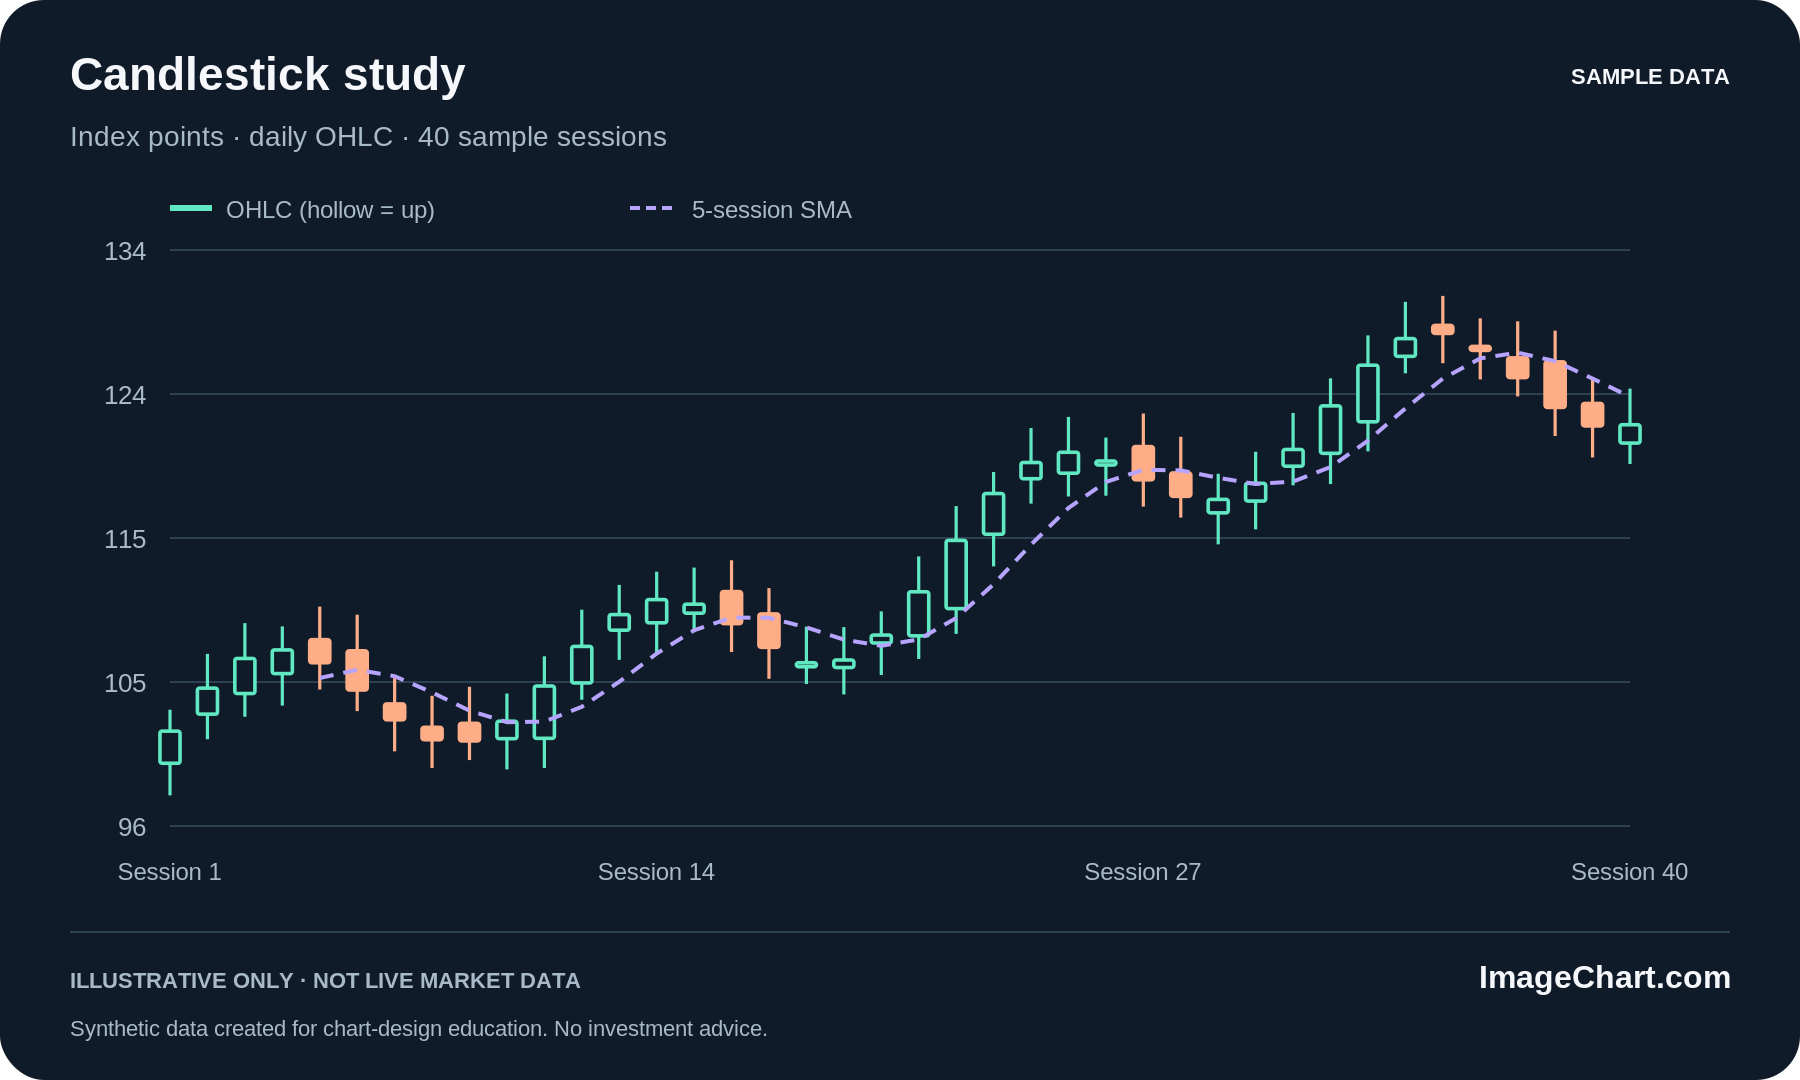
PNG: 1800 × 1080 pixels · SVG: 900 × 540 viewBox · CSV: UTF-8 source values
What this chart shows
The market examples use forty invented daily OHLC observations expressed in index points. The dashed overlay is a five-session simple moving average of the close, calculated before the visible range is selected. Its first four values are unavailable because a complete five-observation window does not yet exist.
What it does not claim
This is not a real security, quotation, backtest, or investment result. Candle direction describes close versus open under the documented convention; it does not forecast a later observation.
Adapt it with the context intact
Choose the file your publishing destination supports. When adapting this layout for your own measurements, replace the title, labels, units, source note, and sample status as well as the plotted marks. Check the values against their original source and retain any rights notices that apply. Editing an SVG by hand does not recalculate the chart.
Keep the illustrative label whenever you use the included values. Check the imported artwork at its final display size, and provide a written explanation or table where readers need an alternative to the image. Read the image chart publishing guide for a practical export workflow.