Revenue trend
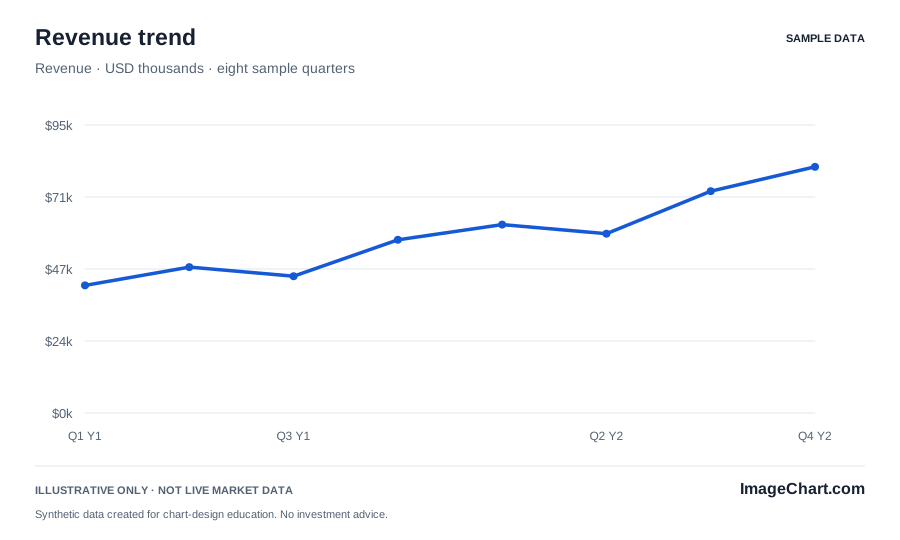
Connect sequential quarterly observations without hiding the original values.
One layout.
Three useful files.
Save the finished PNG, edit the vector SVG in compatible software, or inspect the exact source values in the CSV. All three files describe the same example.
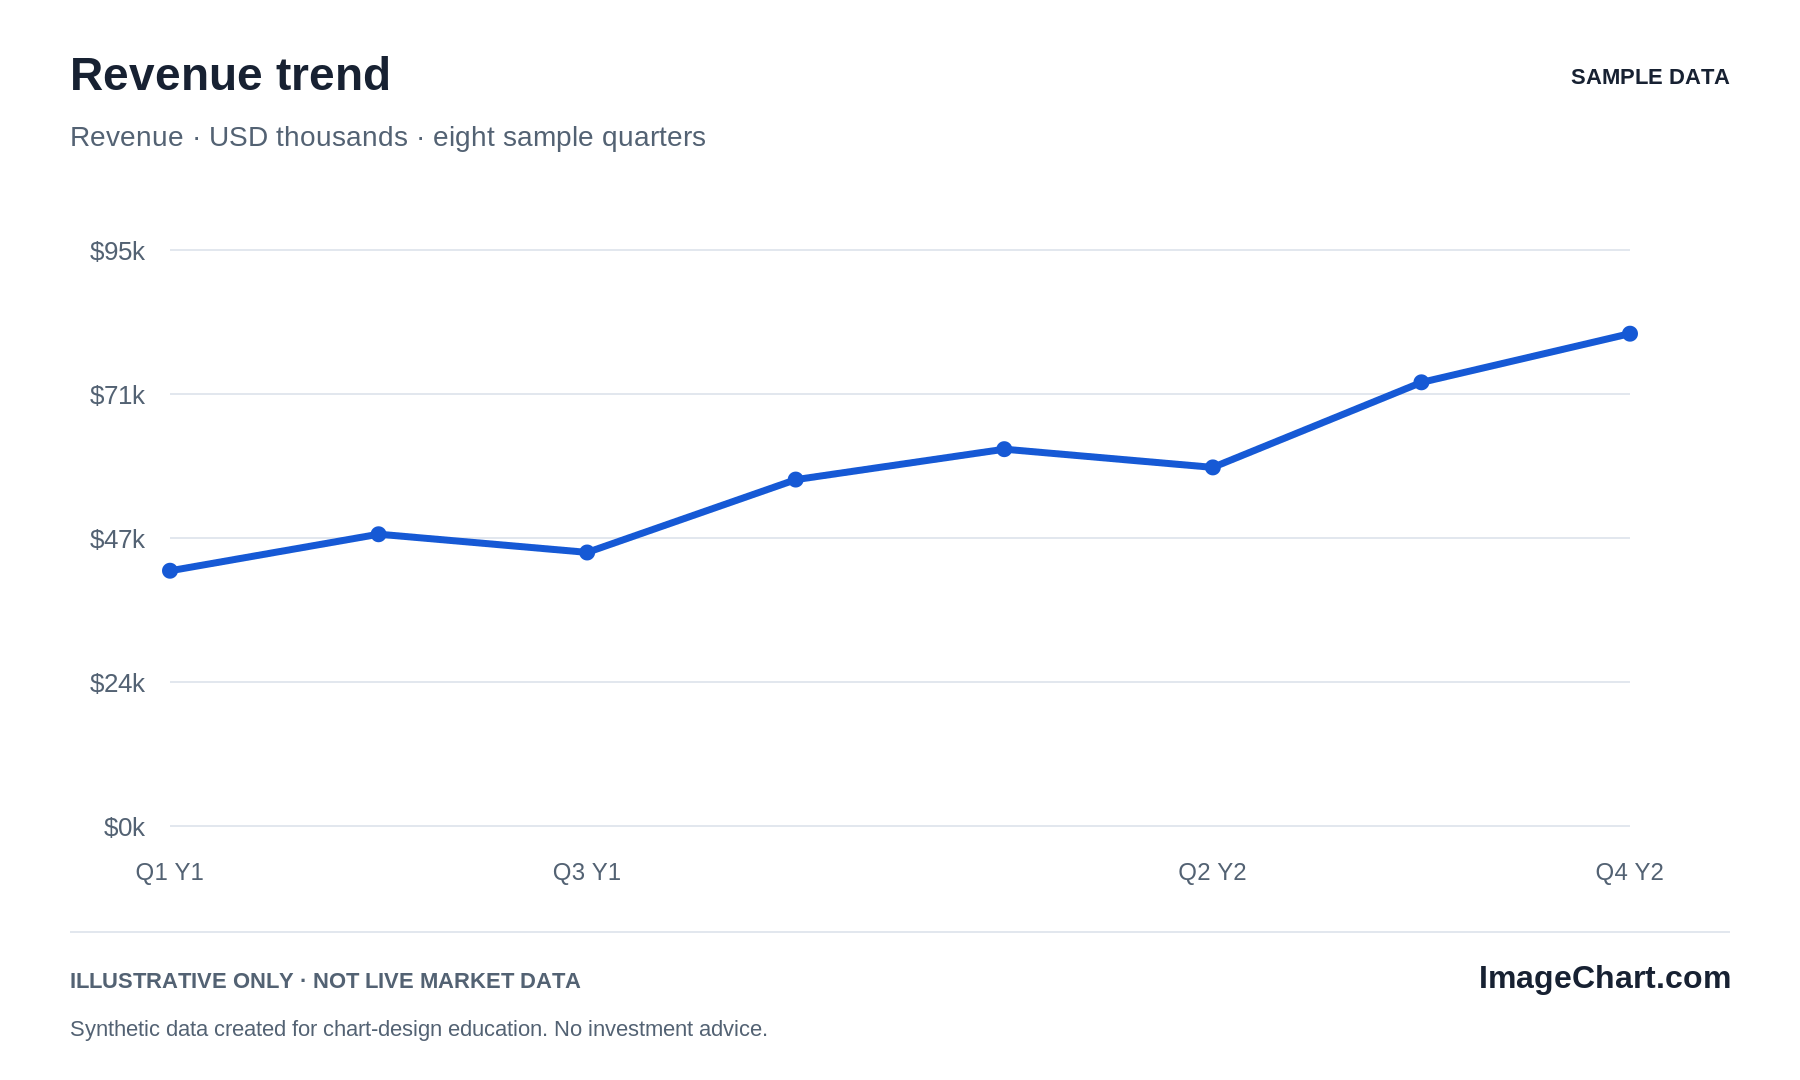
PNG: 1800 × 1080 pixels · SVG: 900 × 540 viewBox · CSV: UTF-8 source values
What this chart shows
The revenue dataset contains eight fictional quarters: 42, 48, 45, 57, 62, 59, 73, and 81, measured in USD thousands. Labels identify Q1–Q4 in example years Y1 and Y2. A zero-based bar view compares magnitude; a line view emphasizes the ordered sequence.
What it does not claim
No business or reporting entity is represented. The sample does not claim audited results, actual growth, seasonality, profitability, or a causal explanation for its changes.
Adapt it with the context intact
Choose the file your publishing destination supports. When adapting this layout for your own measurements, replace the title, labels, units, source note, and sample status as well as the plotted marks. Check the values against their original source and retain any rights notices that apply. Editing an SVG by hand does not recalculate the chart.
Keep the illustrative label whenever you use the included values. Check the imported artwork at its final display size, and provide a written explanation or table where readers need an alternative to the image. Read the image chart publishing guide for a practical export workflow.