Volume context
A separate view of sample trading activity with an explicit shares scale.
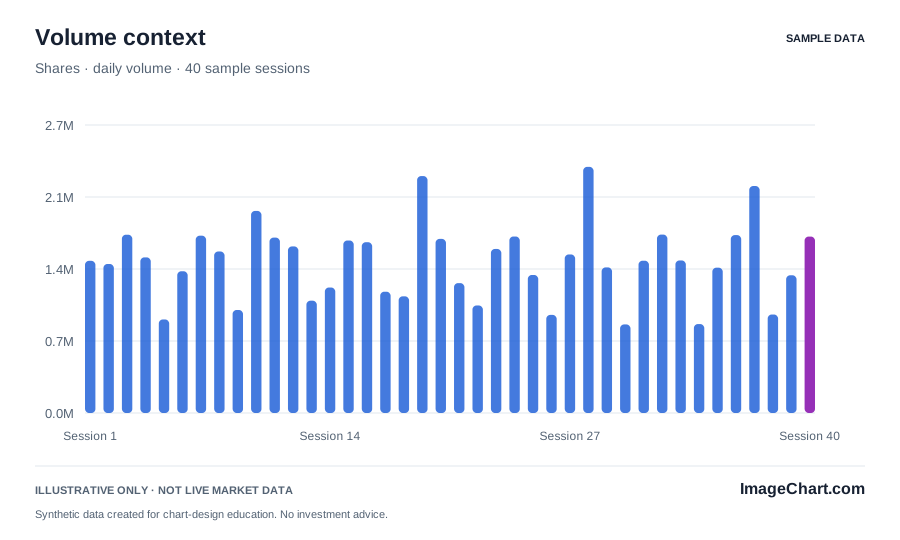
One layout.
Three useful files.
Save the finished PNG, edit the vector SVG in compatible software, or inspect the exact source values in the CSV. All three files describe the same example.
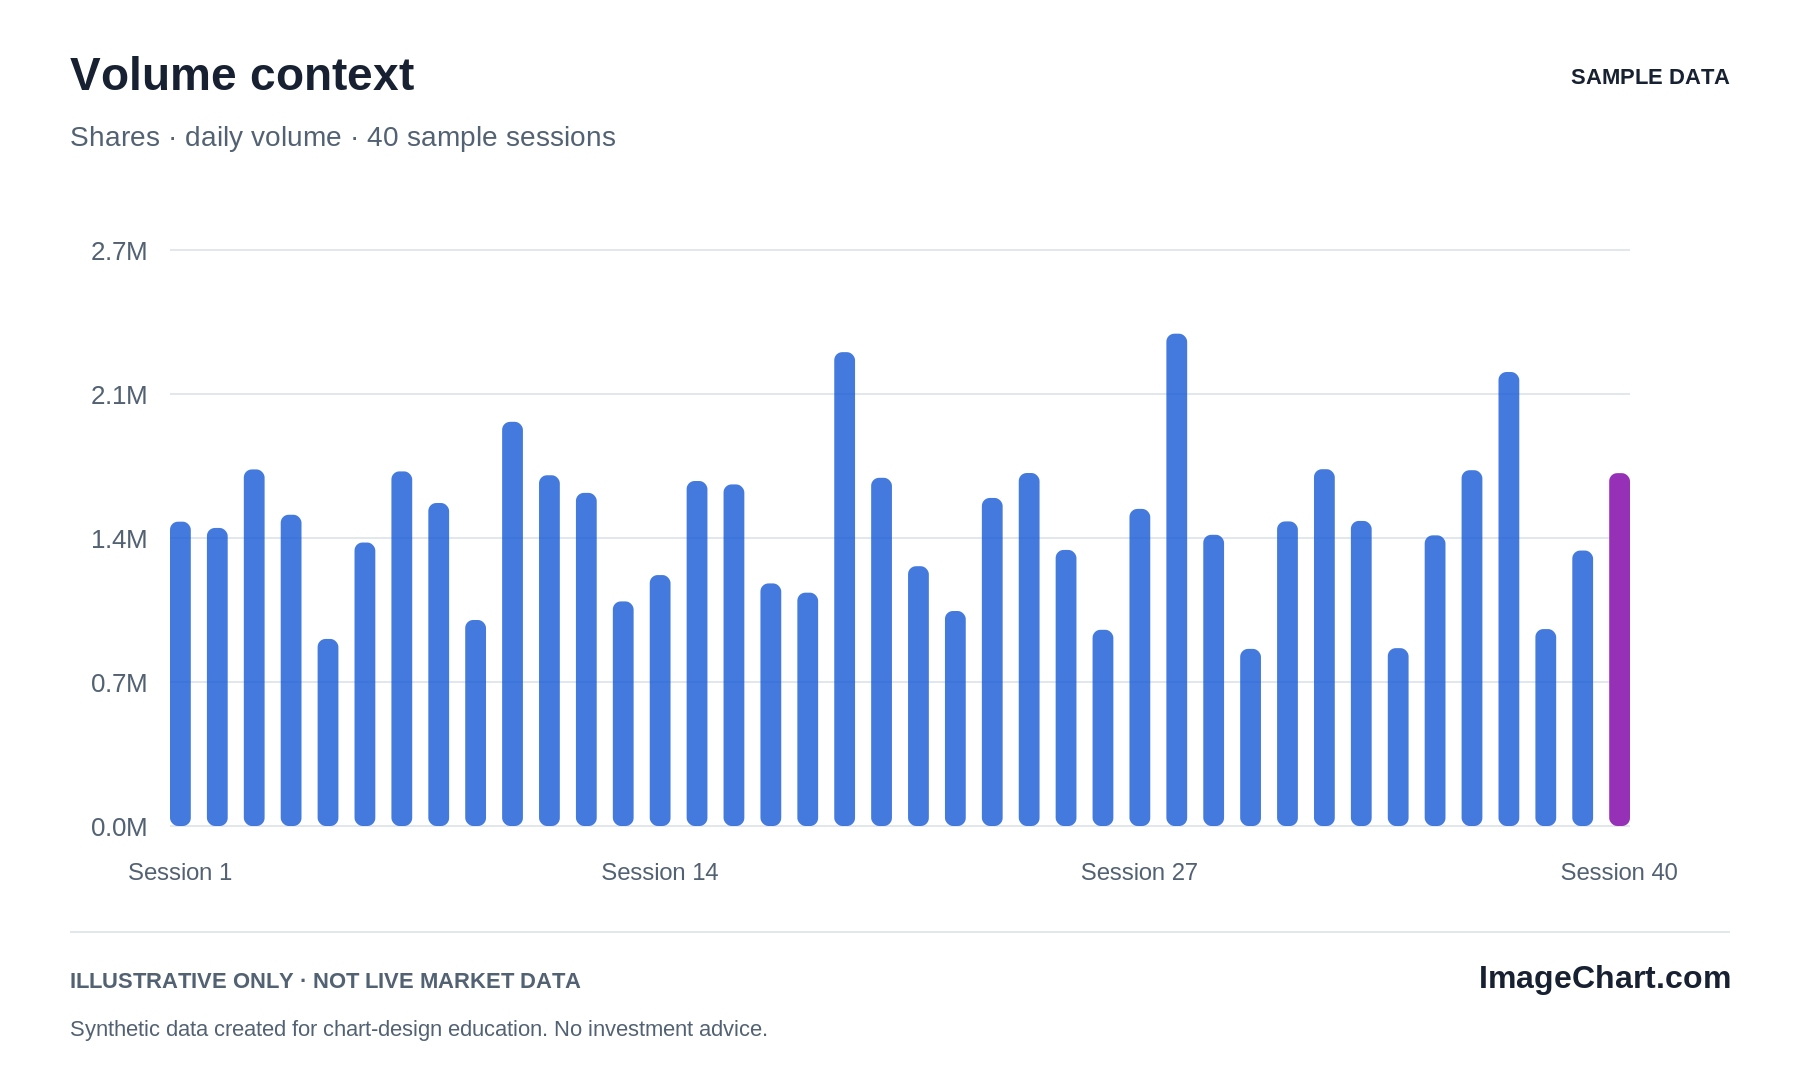
PNG: 1800 × 1080 pixels · SVG: 900 × 540 viewBox · CSV: UTF-8 source values
What this chart shows
The volume chart uses synthetic daily share counts from the same forty-session example sequence as the price dataset. The axis uses millions of shares for compact display; the source CSV preserves the full integer counts. Bars begin at zero.
What it does not claim
The counts do not come from a trading venue or consolidated market feed. A tall sample bar does not establish who traded, why they traded, or what a subsequent price would do.
Adapt it with the context intact
Choose the file your publishing destination supports. When adapting this layout for your own measurements, replace the title, labels, units, source note, and sample status as well as the plotted marks. Check the values against their original source and retain any rights notices that apply. Editing an SVG by hand does not recalculate the chart.
Keep the illustrative label whenever you use the included values. Check the imported artwork at its final display size, and provide a written explanation or table where readers need an alternative to the image. Read the image chart publishing guide for a practical export workflow.