Volume charts: understand the activity behind the bars
Read activity units, compare completed intervals, calculate a baseline, and avoid turning a tall volume bar into an unsupported story.
Read the guideGive overlays, volume, and momentum measures separate jobs, document the settings, and keep historical summaries distinct from forecasts.
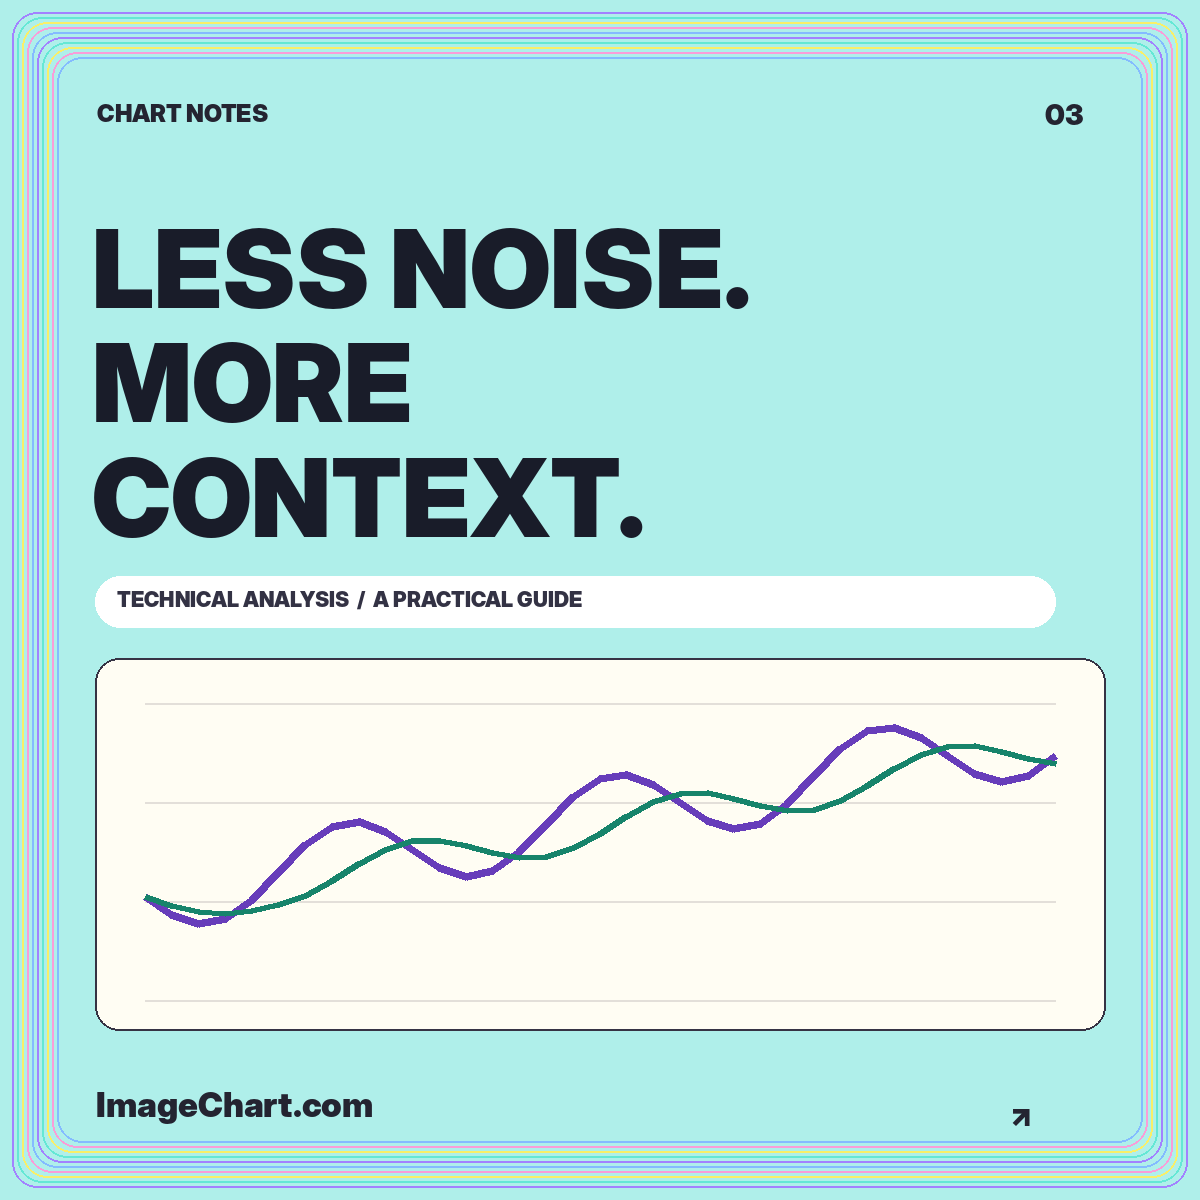
A technical analysis chart can become unreadable long before it runs out of available indicators. Each added line makes another claim about what deserves attention. Without a clear question, the result is often a collection of overlapping summaries of the same price history rather than a more informative explanation.
A better approach is to give every panel a specific job. Use the main panel to show the chosen price measure, an overlay to answer a trend question, and a separate indicator only when it contributes a genuinely different measurement. The technical analysis library follows that separation. This article explains how to design such a layout without presenting historical indicators as guaranteed signals.
Write a sentence that explains what the chart should help someone inspect. For example: “How does the latest closing value compare with a recent average?” This leads naturally to a price line and a moving average. “Did activity change during this interval?” suggests a volume panel. The question limits the display more effectively than a favorite indicator package.
Specify the time horizon and data interval separately. A six-month history made from daily values is different from six months summarized weekly. An indicator expressed in periods inherits that interval, so its meaning changes when the interval changes. A twenty-period daily measure and a twenty-period weekly measure are not interchangeable views of the same calculation.
Name the data source and whether observations are completed. A calculation can be perfectly implemented and still answer the wrong question when its inputs include a partial interval, an unexpected adjustment, or a different price field. Resolve those definitions before selecting the colors.
An overlay belongs on the price panel when its unit is compatible with that axis. A moving average of prices is still expressed in price units. Displaying it beside the original series allows a direct positional comparison. Label the averaging method, lookback, and input field so that another reader could reproduce it.
An oscillator often has a different scale or interpretation. Place it in a separate panel with its own axis rather than stretching a shared price scale to accommodate it. A number such as 60 has different meanings in a price series and a bounded momentum indicator. Visual proximity does not make the units comparable.
Fidelity’s technical analysis overview discusses tools including moving averages, RSI, MACD, and volume. These organize historical information in different ways. In your own layout, explain what each selected measure summarizes instead of assuming an indicator’s name supplies its interpretation.
A moving average smooths selected observations across a window. That makes some short-term variation less prominent, while also making the result dependent on previous values. A longer averaging window incorporates more history. It does not reveal a hidden future path or remove the uncertainty of the original data.
Use the relationship between price and average as a descriptive statement. “The close is above its five-session average” can be verified directly from the series. “The close must keep rising” cannot be deduced from that relationship. The same average can accompany very different subsequent paths.
A chart designed for education should make this distinction explicit. Label the average as historical, keep the original observations visible, and avoid extending the line into future space. The moving-average tutorial includes a worked rolling calculation and explains how missing warm-up values should be handled.
Momentum indicators summarize changes using a specified formula and window. An indicator’s familiar threshold is an interpretive convention, not a guarantee that a reversal occurs at that value. A chart can remain near one end of an indicator’s range for an extended interval without violating the calculation.
When illustrating a threshold, label what the line means. Is it a conventional reference, an analyst-selected rule, or a threshold estimated from a defined dataset? Those are different claims. A faint horizontal rule with no explanation encourages readers to supply an interpretation that the chart may not support.
Keep your language conditional and specific. You can describe when a series crosses a reference level without asserting that the crossing makes a trade suitable. Do not add hypothetical profit arrows to a historical momentum panel unless the example is explicitly framed as an illustration rather than a tested strategy.
Volume measures activity, while a variability measure describes the dispersion or movement of a selected series under a particular definition. Neither is a substitute for the other. A tall activity bar does not directly state how far price moved, and a wide price range does not state how much volume changed hands.
A three-panel teaching chart might therefore contain price, volume, and one momentum measure. But three panels are not automatically better than two. If the article discusses only the relationship between price and an average, the extra panels create visual work without supporting the main explanation.
Align panel widths and timestamps so the same vertical slice refers to the same interval. Keep units visible even when space is tight. For a small social image, consider separating the panels into a short series of related graphics rather than shrinking all labels to fit a single crowded frame.
A support or resistance annotation is not simply a line that happens to look plausible. Explain how the region was selected and which observations it refers to. If it is an illustrative zone rather than a measured result, say so. A range can communicate uncertainty more honestly than a precise-looking price level with no stated basis.
Record the choice before examining later observations when evaluating a rule. Otherwise, it is easy to draw a line through an attractive historical turning point and mistake retrospective fitting for a usable decision process. A teaching image should not disguise this distinction through confident arrows and labels.
Annotations also need a visual hierarchy. Put the most important note near the relevant interval, use a connector when necessary, and keep the text off the evidence. Readers should be able to identify the target without guessing whether a note refers to one candle, a group of candles, or an entire trend.
Two indicators derived from the same closing-price series may respond to many of the same movements. Their agreement does not automatically create independent evidence. Before adding another line, write down the new information it contributes and the assumption it requires. If those sentences duplicate an existing panel’s purpose, simplify the layout.
This is particularly useful for educational publishing. Readers can understand a carefully explained transformation more readily than an unexplained stack of popular indicators. One clear calculation with a visible data table is often a stronger lesson than an impressive-looking dashboard with no reproducible details.
Compare an annotated draft with a stripped-down version. Does the extra panel change the descriptive conclusion, reveal a limitation, or answer a distinct question? If not, remove it. A chart should earn its complexity through additional understanding, not through the number of available controls it displays.
A chart image can explain inputs, relationships, and historical sequences. It cannot, by itself, validate a trading strategy. Strategy evaluation requires explicit entry and exit rules, a defined sample, treatment of transaction costs and execution assumptions, and safeguards against using later information prematurely.
Even a correctly calculated historical result does not establish that future conditions will match the sample. A display also needs to distinguish actual observations from simulations. Avoid presenting a smooth example line as an account record, a forecast, or a provider-verified performance history.
Before exporting, confirm that the title, interval, price field, indicator settings, and source travel with the graphic. Add a text explanation and a data table when the image contains information readers may need to inspect precisely. The accessible chart guide explains how those elements complement the visual display.
Choose the fewest components that answer the stated question without hiding relevant limitations. Preserve enough context to interpret the result, and label every transformation that changes the original data. Make the chart’s descriptive purpose clear before the reader encounters any indicator name.
Technical analysis charts are most useful as disciplined visual summaries. Their polish should come from precise definitions, readable scales, and restrained annotation. A clean chart does not reduce investment uncertainty to a pattern; it makes the historical information and the limits of your interpretation easier to see.
All worked numerical examples are hypothetical. Educational material, not personal investment advice. See our data and editorial methodology.
Read activity units, compare completed intervals, calculate a baseline, and avoid turning a tall volume bar into an unsupported story.
Read the guide
Learn a repeatable approach to chart identity, intervals, scales, price changes, and the difference between a visible pattern and an explanation.
Read the guide
Reconstruct open, high, low, and close, understand fill conventions, and distinguish a descriptive candle pattern from a prediction.
Read the guide