Technical analysis charts: a clearer layout, not more noise
Give overlays, volume, and momentum measures separate jobs, document the settings, and keep historical summaries distinct from forecasts.
Read the guideRead activity units, compare completed intervals, calculate a baseline, and avoid turning a tall volume bar into an unsupported story.
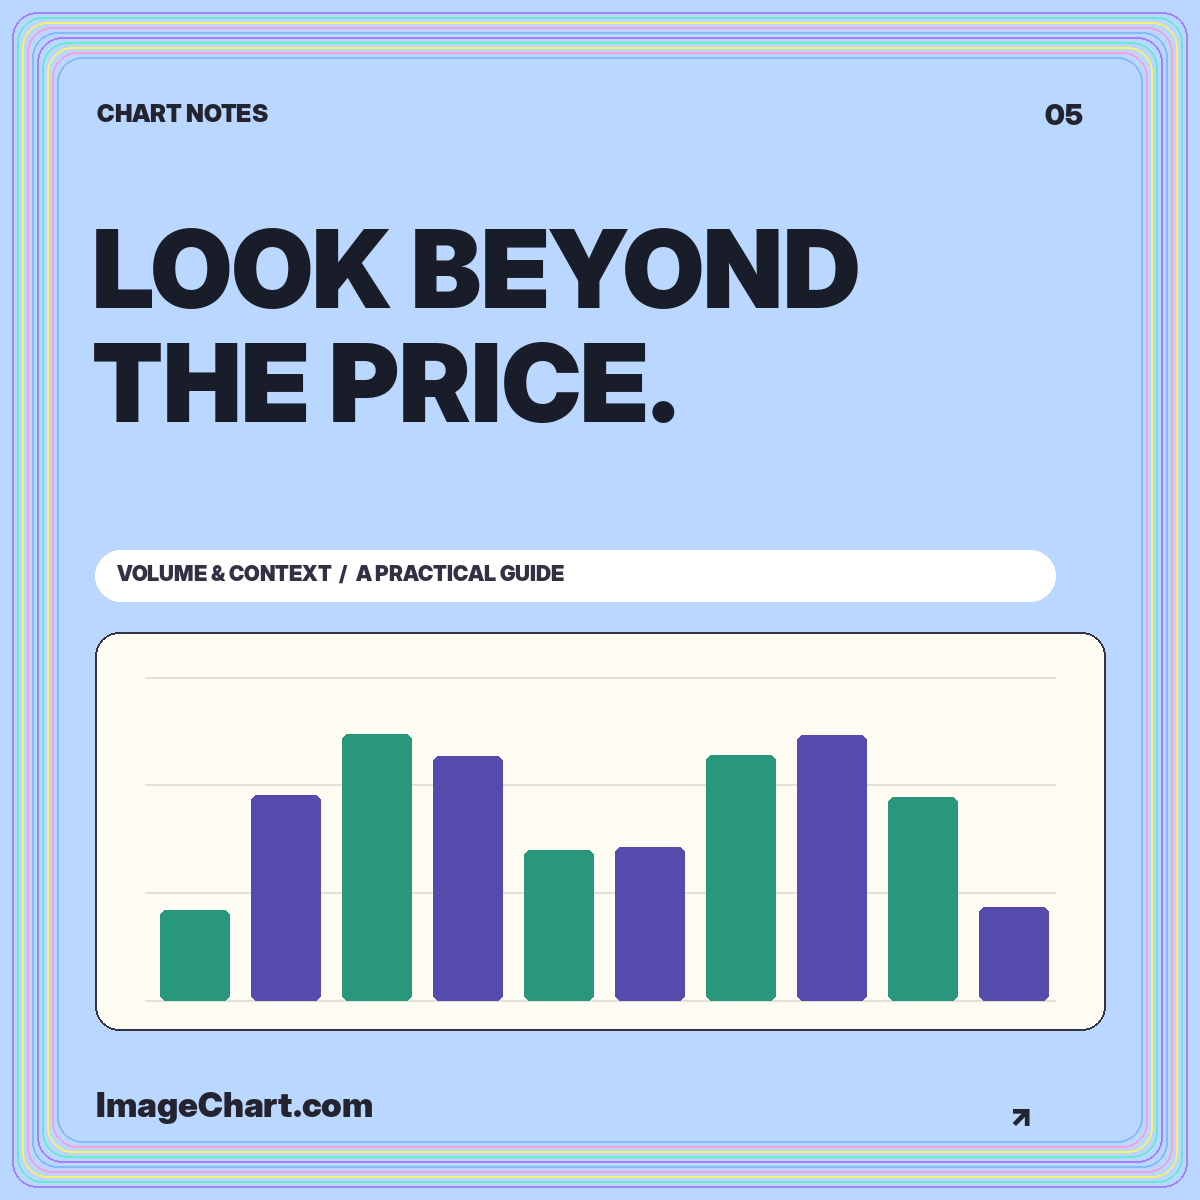
A volume chart answers a different question from a price chart. Price shows where a selected measure was recorded; volume shows how much activity was reported during an interval under the provider’s definition. Putting them together can add context, but only when the units, timestamps, and coverage are clear.
This tutorial uses invented share counts to explain the display. It does not identify unusual activity in a real security or recommend a trading response. Use the volume context template to inspect a straightforward zero-based bar chart, then compare it with the synthetic price series in the stock chart library. The objective is to make activity understandable without turning a tall bar into a prediction.
Start with the unit. A volume field might count shares, contracts, traded notional value, or another provider-defined measure. These quantities are not interchangeable. A million shares and a million dollars of turnover describe different things, even though both can appear beside the abbreviation “1M.”
Write the unit on the axis or in the subtitle and include the data coverage where relevant. Activity from a single trading venue may not represent the total across venues. A dataset may also apply corrections or aggregation rules that differ from another provider’s history. Comparing numbers without their definitions creates a misleading appearance of precision.
For an educational example, be equally explicit. The ImageChart volume dataset contains synthetic daily share counts. It is not a measured market total. A clear sample-data label belongs inside the exported graphic, not only on the webpage where the chart first appeared.
A daily volume bar should summarize the same interval as the associated daily price observation. If the price chart uses weekly candles, aggregate volume according to a documented weekly definition as well. Readers should not have to discover that the upper and lower panels use different clocks.
Partial periods need particular care. A volume count halfway through a session is incomplete relative to a completed daily bar. Its smaller height may simply reflect fewer elapsed hours. Label the partial interval and avoid presenting a direct full-period comparison without an explicit adjustment method.
Similarly, check shortened sessions and gaps. An absent bar is not necessarily zero activity; it may indicate a missing observation or an interval outside the dataset’s coverage. Keep missingness visible rather than filling every gap with zero for the sake of a smooth-looking dashboard.
Suppose five completed sample sessions record 0.8, 1.0, 1.2, 0.9, and 1.1 million shares. Their mean is 1.0 million. A subsequent completed session at 1.5 million is 50% above that baseline because the excess of 0.5 million is divided by the baseline of 1.0 million.
Document whether the comparison window excludes or includes the current session. Excluding it compares the current observation with an earlier baseline. Including it changes the baseline as the current value changes. Both are definable calculations, but they answer slightly different questions and should not share an ambiguous label.
A caption such as “50% above the previous five completed sessions’ mean” is more informative than “high volume.” It exposes the denominator and window. Do not attach that calculation to a claim that the price must continue in the same direction; relative activity is not a direct forecast.
A volume oscillator compares shorter and longer moving averages of volume rather than displaying the raw activity count. Fidelity’s volume oscillator guide defines one version as the difference between those averages divided by the longer average, expressed as a percentage.
For an invented short average of 1.2 million and a long average of 1.0 million, that formula produces 20%. The oscillator’s unit is a percentage difference between two summaries, not shares. It therefore needs a different axis and explanation from the original volume bars.
Keep the raw series available when teaching the transformation. A positive oscillator value says the shorter average is above the longer average under the selected settings. It does not reveal the complete distribution of individual observations or establish a reason for the activity. Those require additional context and evidence.
Many volume panels color bars according to a price rule, such as close versus open or close versus previous close. That does not mean the entire bar consists only of buying or only of selling. The color summarizes the chosen price comparison while the bar height represents activity.
Write the coloring rule explicitly. A bar linked to a positive open-to-close session can coexist with a negative close-to-close change after a gap. The candlestick explanation works through that distinction. A legend that says only “up” and “down” is often too vague for a standalone image.
For a chart focused strictly on volume magnitude, neutral bars with a single highlighted interval may communicate more clearly than a red-and-green sequence. The highlight should identify the interval being discussed, not imply that its activity is inherently favorable or unfavorable.
Bar height encodes magnitude from a baseline, so a zero-based scale makes the quantity easier to compare honestly. A truncated volume-bar axis can make a modest difference look much larger than its numerical size. When a close-up is necessary, consider a different representation or a prominent explanation of the restricted range.
Two charts placed side by side also need attention. If each uses an independently fitted maximum, a low-activity period may look as tall as a high-activity period. Shared limits make direct visual comparison possible. Independent scales can still be useful for examining shape, but the difference needs to be obvious.
Label abbreviated units consistently. Switching from thousands to millions across panels without a visible unit change invites errors. An axis label of 1.2M should mean the same quantity wherever it appears in that figure, or the caption should explain why it does not.
An activity spike can coincide with a reported event, but coincidence alone does not establish why trading occurred. Separate the observable relationship from any explanation drawn from other evidence. A chart may show that volume increased during a particular interval; it cannot reveal every participant’s reason for trading.
An educational annotation can say “largest sample observation in this window” when that is numerically true. A stronger claim such as “institutions accumulated shares here” needs evidence that the ordinary activity bars do not provide. Avoid writing a confident narrative simply because a chart contains an eye-catching extreme.
Use a brief point label for the observation and place any longer contextual discussion outside the plot. That keeps the data visible while preserving room for qualifications. When exporting, make sure the explanatory text remains available alongside the image rather than living only in a hover tooltip.
Validate nonnegative activity values when the field definition requires them. Check duplicate timestamps, sorting, missing intervals, and the meaning of any revised records. A repeated row can double-count activity after aggregation, while an incorrectly sorted sequence can create a false temporal pattern.
Review the total and the maximum against the data file, then inspect the chart at its intended display size. Bars should remain distinct, axis labels should remain readable, and the selected interval should be clear. Provide a text summary and a downloadable table so readers do not need to estimate precise values from pixels.
For the sample template, the CSV and graphic come from the same deterministic data sequence. That consistency is more important than decorative complexity. The image chart publishing guide explains how to preserve the sample label, units, and source note in a portable export.
A useful volume chart makes its definition and comparison baseline visible. It distinguishes incomplete intervals from complete ones, raw counts from transformed measures, and descriptive observations from causal stories. These distinctions prevent a simple bar display from implying more than the dataset supports.
Use volume as one piece of documented context. A tall bar can be worth examining without becoming a trading instruction. The strongest educational chart gives readers enough information to understand the measurement, check the comparison, and recognize what remains unknown.
All worked numerical examples are hypothetical. Educational material, not personal investment advice. See our data and editorial methodology.
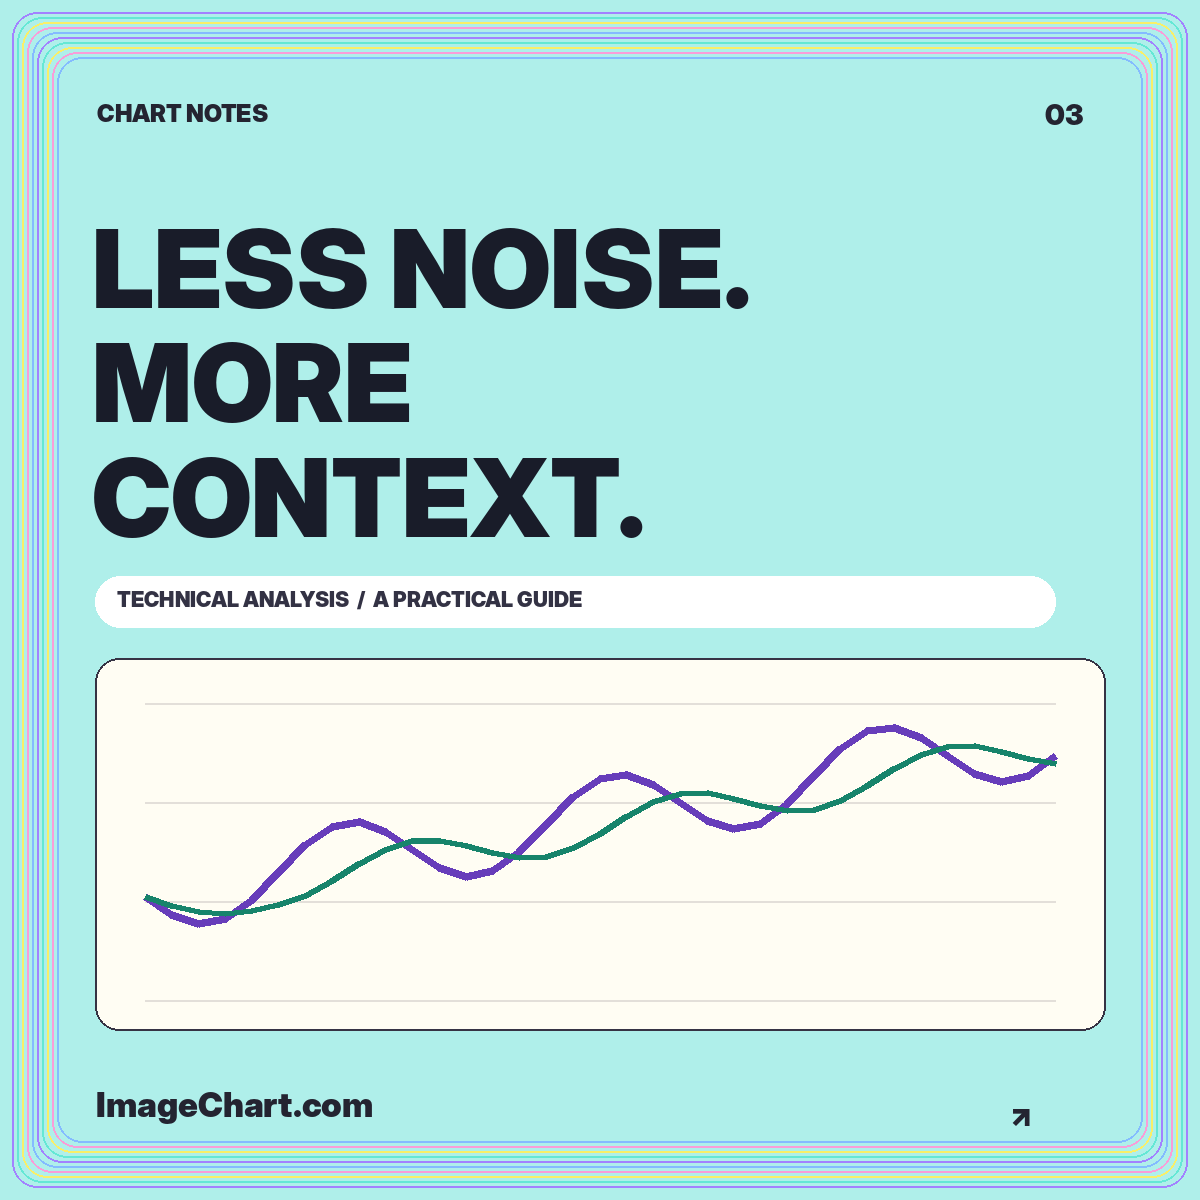
Give overlays, volume, and momentum measures separate jobs, document the settings, and keep historical summaries distinct from forecasts.
Read the guide
Learn a repeatable approach to chart identity, intervals, scales, price changes, and the difference between a visible pattern and an explanation.
Read the guide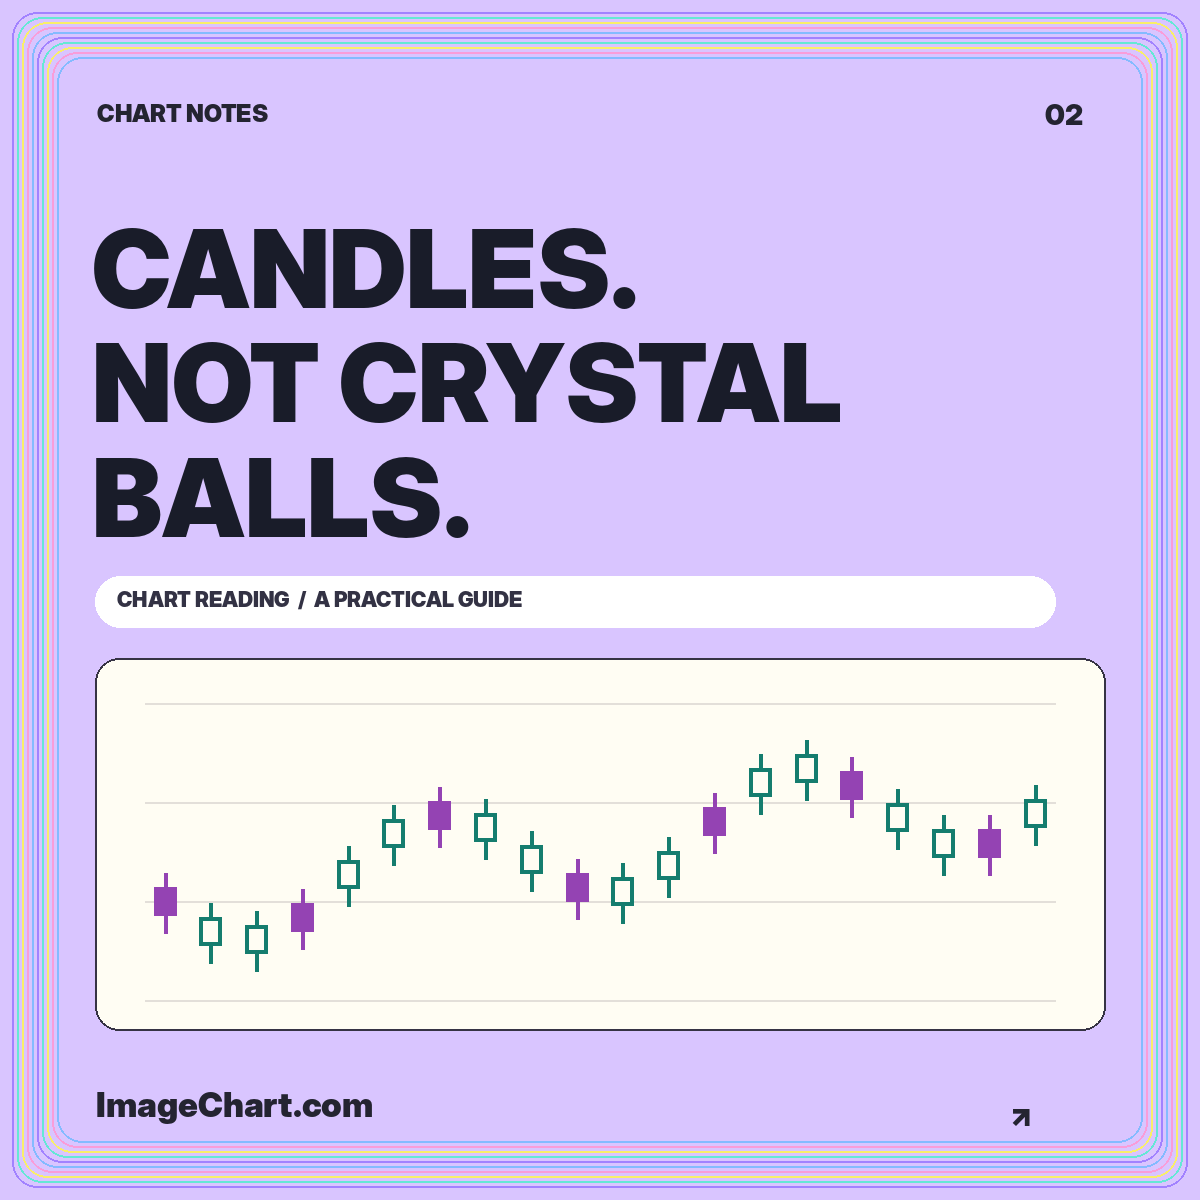
Reconstruct open, high, low, and close, understand fill conventions, and distinguish a descriptive candle pattern from a prediction.
Read the guide