Moving average charts: the calculation behind the line
Work through a five-session simple moving average, warm-up values, smoothing, lag, and the settings a useful legend should preserve.
Read the guideReconstruct open, high, low, and close, understand fill conventions, and distinguish a descriptive candle pattern from a prediction.
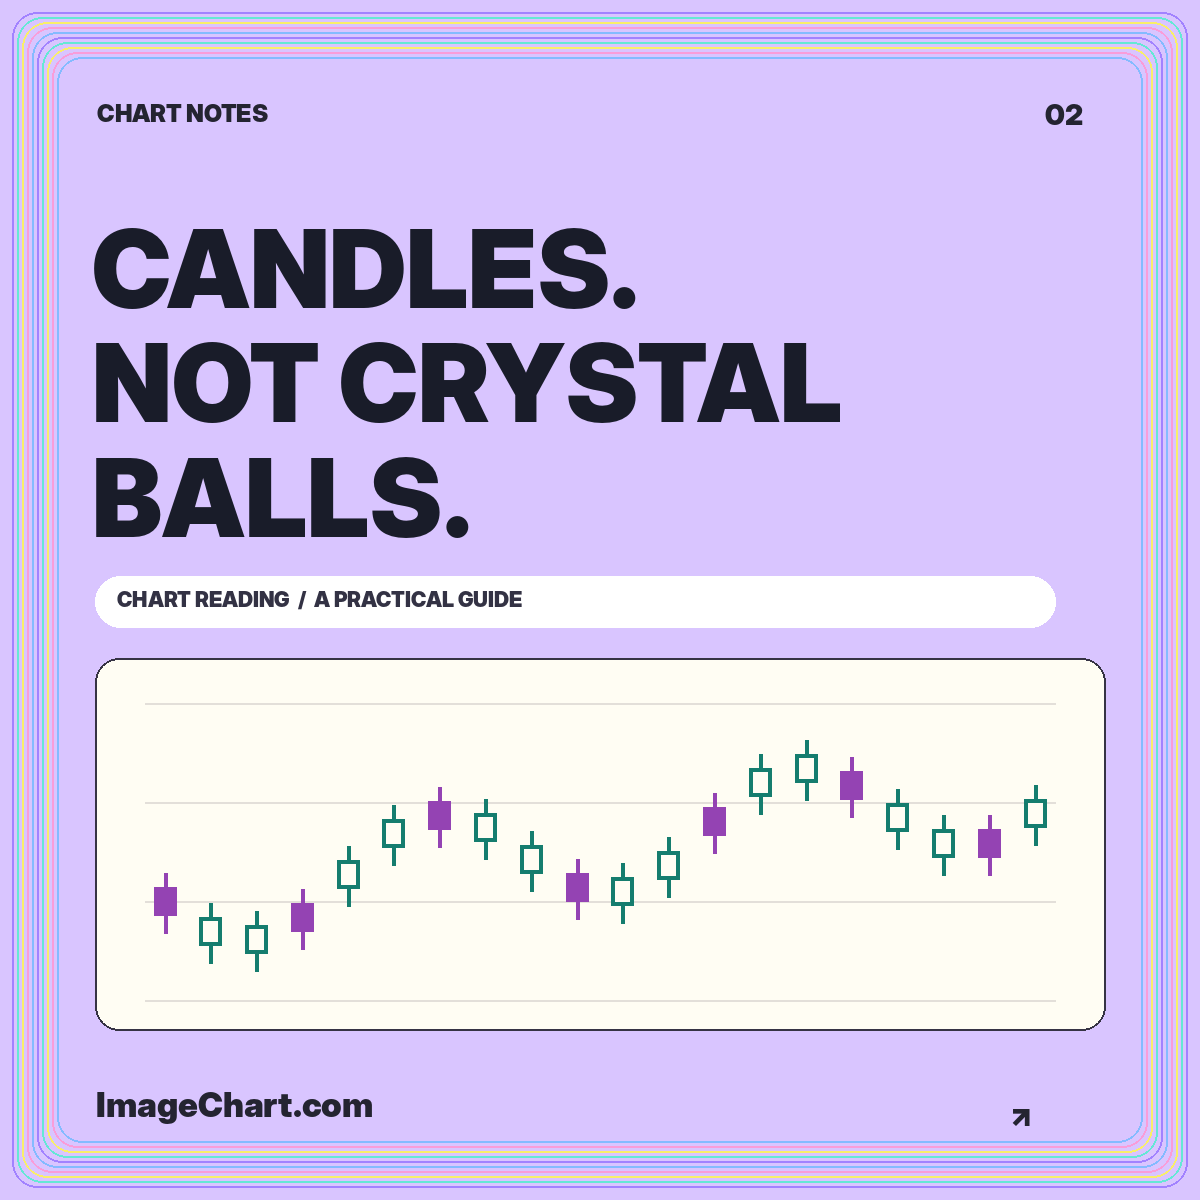
Candlesticks pack four prices into a small amount of space. That compactness makes them useful, but it also makes them easy to overinterpret. A candle is a record of an interval’s open, high, low, and close. It is not a transcript of every trade, a direct reading of investor psychology, or a promise about what comes next.
The most useful first skill is reconstruction: look at a candle and explain the prices that produced it. Only then should you consider names such as doji or engulfing pattern. This guide uses hypothetical observations throughout. The candlestick study template provides a clearly labeled example, while the chart studio lets you compare a candle view with a close-price line.
Consider a session with an open of 100, a high of 108, a low of 97, and a close of 105. The body spans 100 to 105. The upper wick reaches 108, and the lower wick reaches 97. Body height is five units; the complete high-to-low range is eleven. Those measurements describe different aspects of the same interval.
Now change only the close to 99. The range remains eleven units, but the body becomes much smaller and points in the opposite open-to-close direction. A close-only line would reveal only the changed closing point. The candle exposes additional information, provided the body and wicks remain distinguishable at the display size.
Fidelity’s technical indicator guide places chart overlays and indicators within an educational technical-analysis framework. Use these tools as ways to organize historical observations. Any interpretation should remain separate from the four values that actually define the candle.
Color settings differ across charting interfaces. One display may use green and red for close versus open. Another may distinguish hollow from filled bodies and use color for close versus the previous close. Before interpreting a screenshot, inspect its legend or settings. A color without a documented rule is not a sufficiently precise data label.
An invented session can close above its own open and still finish below the previous close. Suppose yesterday closed at 110, today opened at 100, and today closed at 104. The open-to-close change is positive, while the close-to-close change is negative. Neither calculation is wrong; they answer different questions.
The ImageChart example uses hollow bodies for sessions closing at or above their opens and filled bodies for sessions closing below their opens. Wicks and outlines preserve the structure when color is difficult to distinguish. Include the convention in the exported legend rather than assuming everyone knows what the palette means.
A doji is commonly used to describe a candle whose opening and closing values are the same or very close. In practical chart work, “very close” needs a definition. Two values a few cents apart may be almost identical for one instrument and substantial for another. A reproducible annotation should say which tolerance was used.
Imagine an open of 50.00, a close of 50.02, a high of 52.00, and a low of 48.50. The nearly flat body does not mean nothing happened. The session’s full range is 3.50. It also does not reveal whether the high preceded the low or how long the price stayed near either extreme.
When creating an educational infographic, annotate the body and the full range separately. A defensible caption says the open and close were near each other despite a wider intraperiod range. A claim that a reversal is inevitable goes beyond the information contained in those four values.
A two-candle pattern depends on both the observations and the rule used to compare them. An engulfing-body description, for example, concerns whether one candle’s open-to-close body spans the preceding body. That is different from requiring the entire high-to-low range to contain the previous range. State which relationship your illustration shows.
Use concrete values when teaching the distinction. If the first body runs from 104 to 101 and the second runs from 100 to 106, the second body spans the first. But its low or high can still create a different relationship when the complete ranges are compared. A diagram with no numerical labels can hide this ambiguity.
Decide whether equal boundaries count, whether gaps are required, and how the preceding context is defined. Consistent rules matter more than decorating a chart with familiar names. When two people label the same history differently, the disagreement may be about their definitions rather than an error in the underlying prices.
A daily candle and a weekly candle can tell different-looking stories because they aggregate different intervals. Five daily bodies do not visually add up to a weekly body. The weekly open comes from the beginning of the selected week, its close from the end, and its high and low from the extremes within it.
Aggregation removes chronology. Consider a week that visits both 90 and 120 and finishes at 105. A weekly candle shows the range, but not whether the deeper decline occurred before or after the rally. The order may matter to your explanation, so use a more detailed panel when the sequence is the point.
Do not switch intervals halfway through an argument without telling the reader. If a short-period pattern is being discussed alongside a longer trend, label both views prominently. Consistent axes and aligned dates make that comparison easier than placing two unrelated screenshots next to each other.
A carefully selected historical example can teach a shape without establishing how often it works. Choosing a pattern after seeing the subsequent movement introduces hindsight into the illustration. A visually memorable success is not a performance study, even when the annotated chart is accurate.
A meaningful evaluation would need explicit rules, a defined sample, treatment of failed signals, and costs appropriate to the proposed use. It would also need to avoid using information that was unavailable at the decision time. Without those details, avoid numerical success rates and language implying tested predictive value.
For an educational card, label the pattern as a structural example. Explain what satisfies the definition, then mention what the candle leaves unknown. This creates a stronger teaching image than a large arrow labeled “next move,” because readers can verify the descriptive claim from the visible values themselves.
Start with the intended display width, not the largest working canvas available. Forty candles may remain readable in a broad desktop graphic but collapse into a dense strip in a small social preview. Reduce the number of observations or use a close-up when readers need to inspect individual bodies and wicks.
Use enough separation to distinguish neighboring candles. Make the wick visible against both the body and the background. If the layout includes a moving average, distinguish that line with a label or dash pattern rather than color alone. Our moving-average guide explains why its lookback period also belongs in the legend.
Keep annotations outside the data whenever possible and connect them to an unambiguous target. A label covering a wick removes the evidence it is intended to explain. Show open, high, low, and close in an adjacent text panel or table when exact reconstruction is important.
Before sharing a candlestick image, verify the interval, price unit, color and fill conventions, session completeness, and any adjustment method. Confirm that each high is at least as large as its open and close and that each low is at most as small. These basic consistency checks catch malformed example data before visual polish hides the problem.
Then read every sentence as a claim. Descriptions of body size, range, and relative position should be supported by the displayed observations. Interpretive statements need their own evidence and qualifications. A chart can demonstrate a pattern’s geometry without demonstrating that acting on it would have been profitable.
Candlestick literacy begins with four prices and a clear legend. Pattern vocabulary becomes useful only when it makes those observations easier to describe. Keep the difference between description and prediction visible, and your charts will teach more while promising less.
All worked numerical examples are hypothetical. Educational material, not personal investment advice. See our data and editorial methodology.
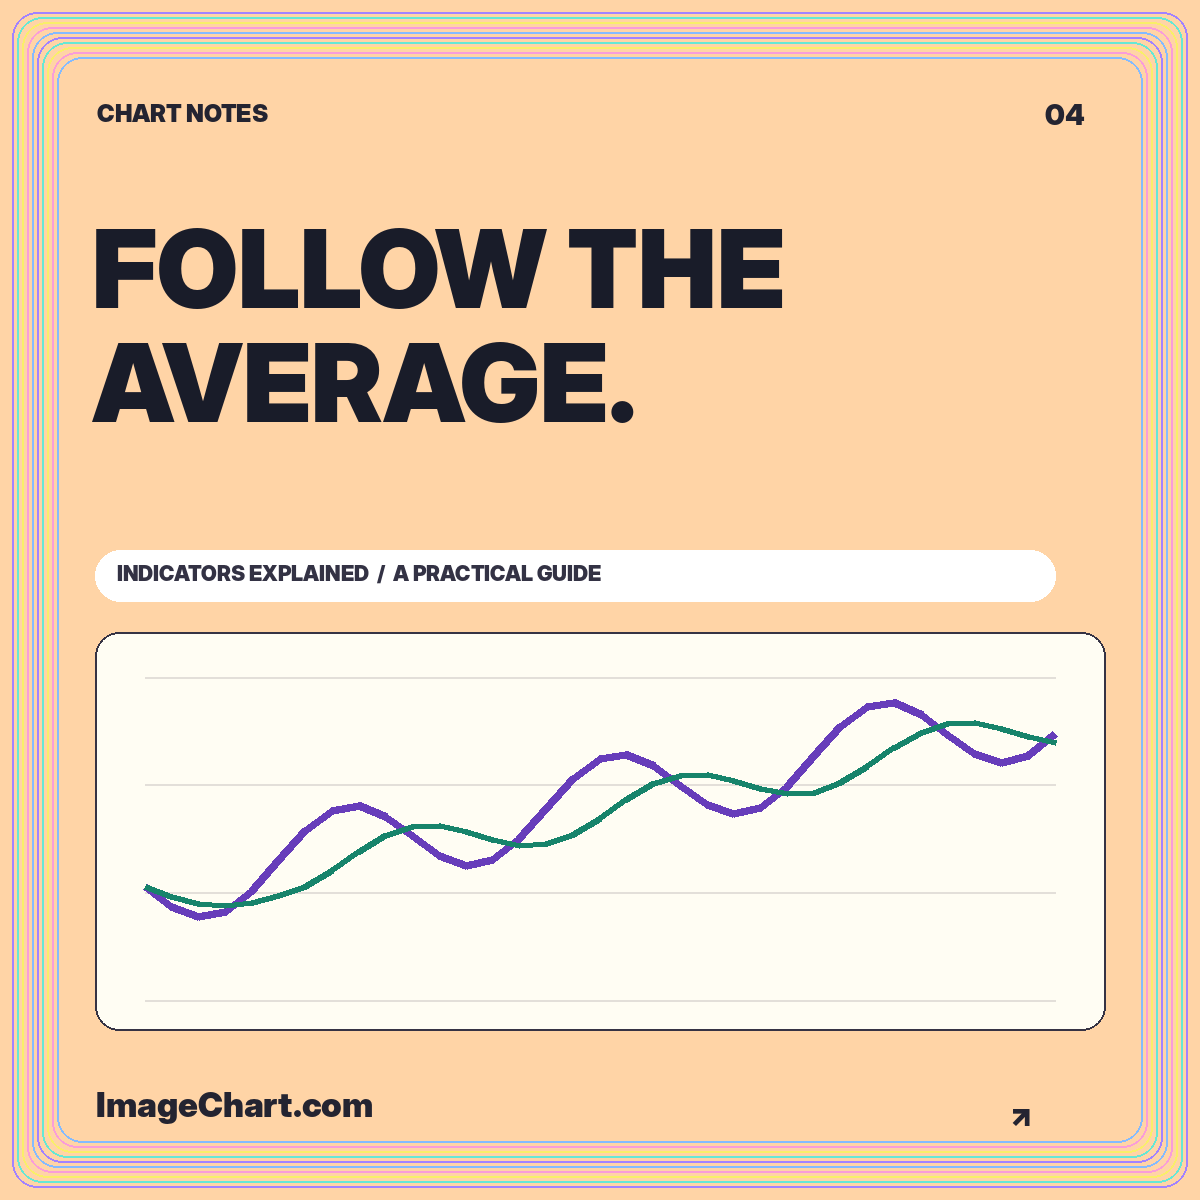
Work through a five-session simple moving average, warm-up values, smoothing, lag, and the settings a useful legend should preserve.
Read the guide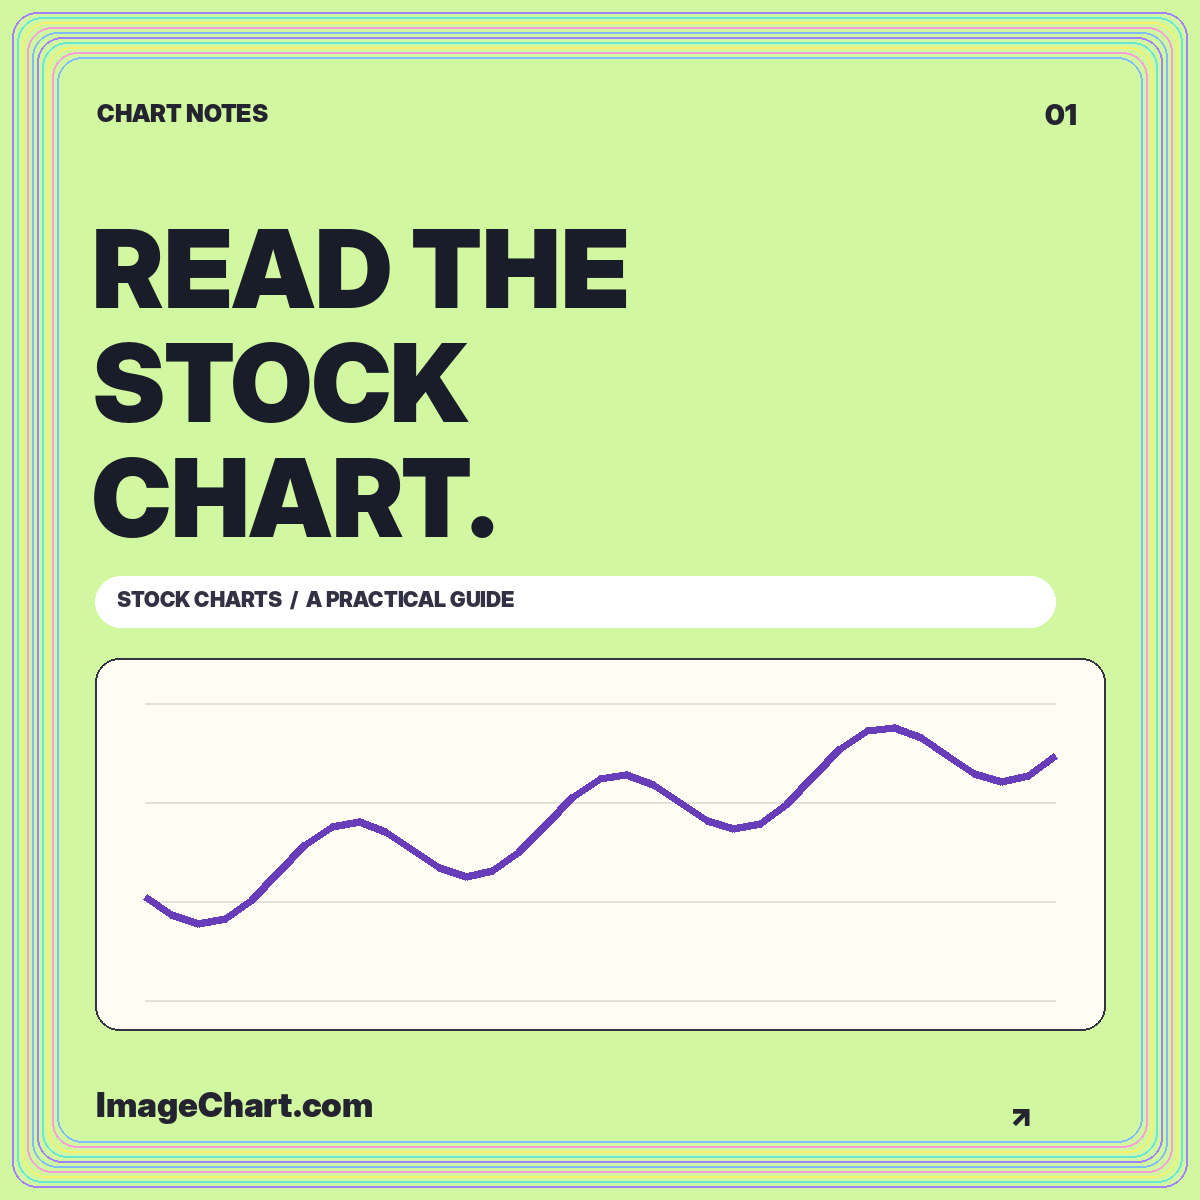
Learn a repeatable approach to chart identity, intervals, scales, price changes, and the difference between a visible pattern and an explanation.
Read the guide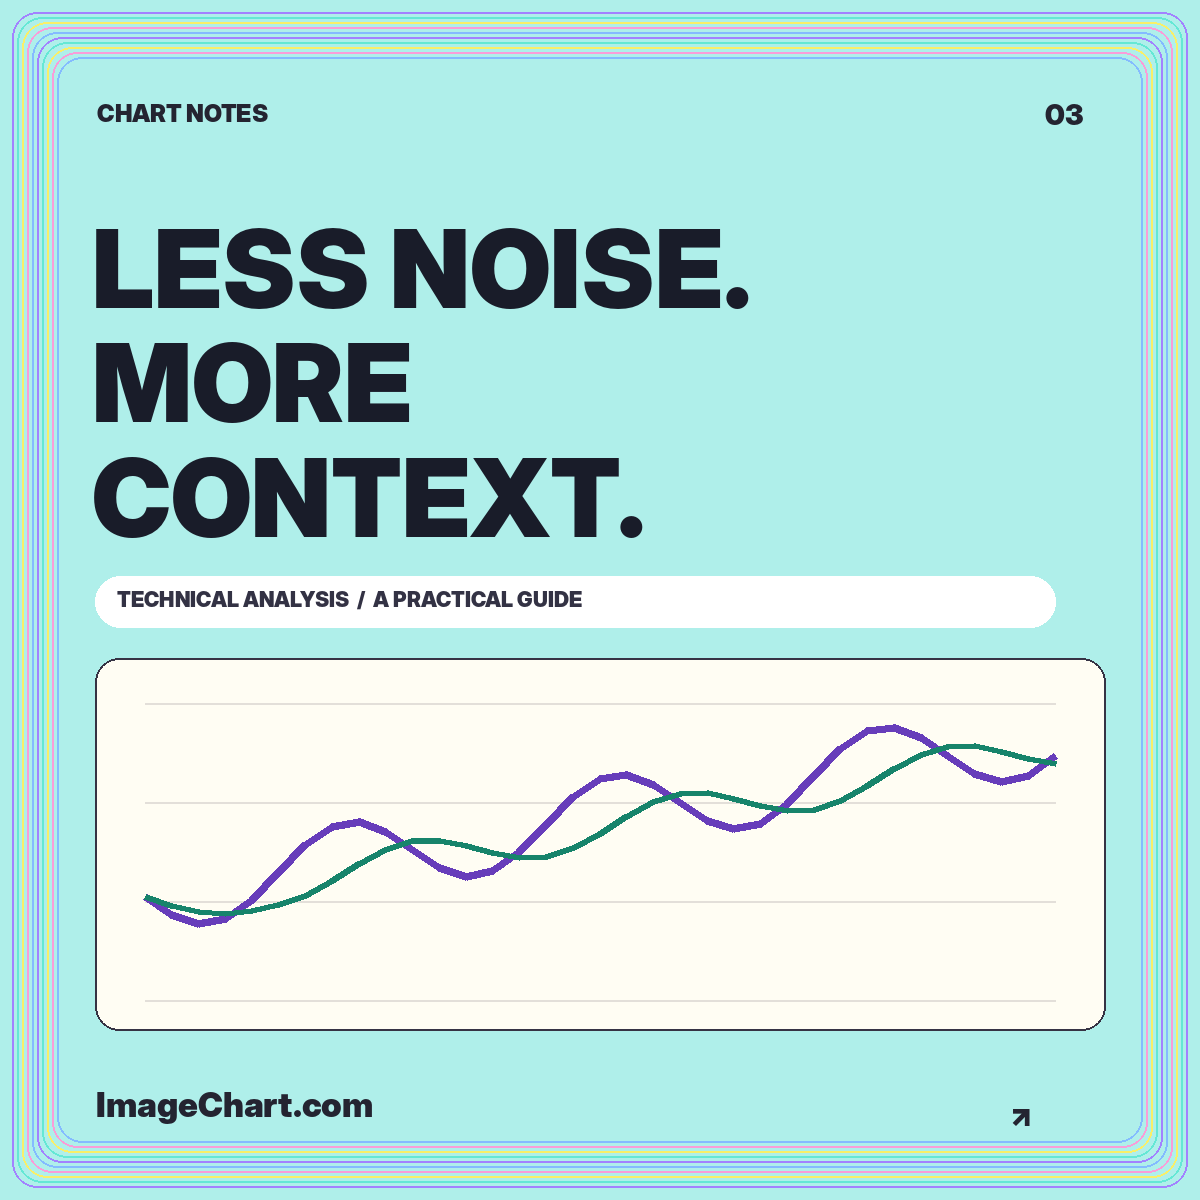
Give overlays, volume, and momentum measures separate jobs, document the settings, and keep historical summaries distinct from forecasts.
Read the guide