How to read stock charts without losing the context
Learn a repeatable approach to chart identity, intervals, scales, price changes, and the difference between a visible pattern and an explanation.
Read the guideBuild a repeatable first pass: identify the measure, check the interval and scale, and describe the visible relationship before interpreting it. These articles connect concrete values to the lines and candles that represent them. Use the studio’s supporting tables to check calculations rather than estimating exact numbers from pixels.
Begin with the question you want to answer, then inspect the matching example and its source values. These guides use invented data to make definitions and calculations reproducible. Read the visible measure, unit, period, and limitation together; no chart example here is a live market quote or a personal recommendation. The related topic links below offer different routes through the same editorial library.
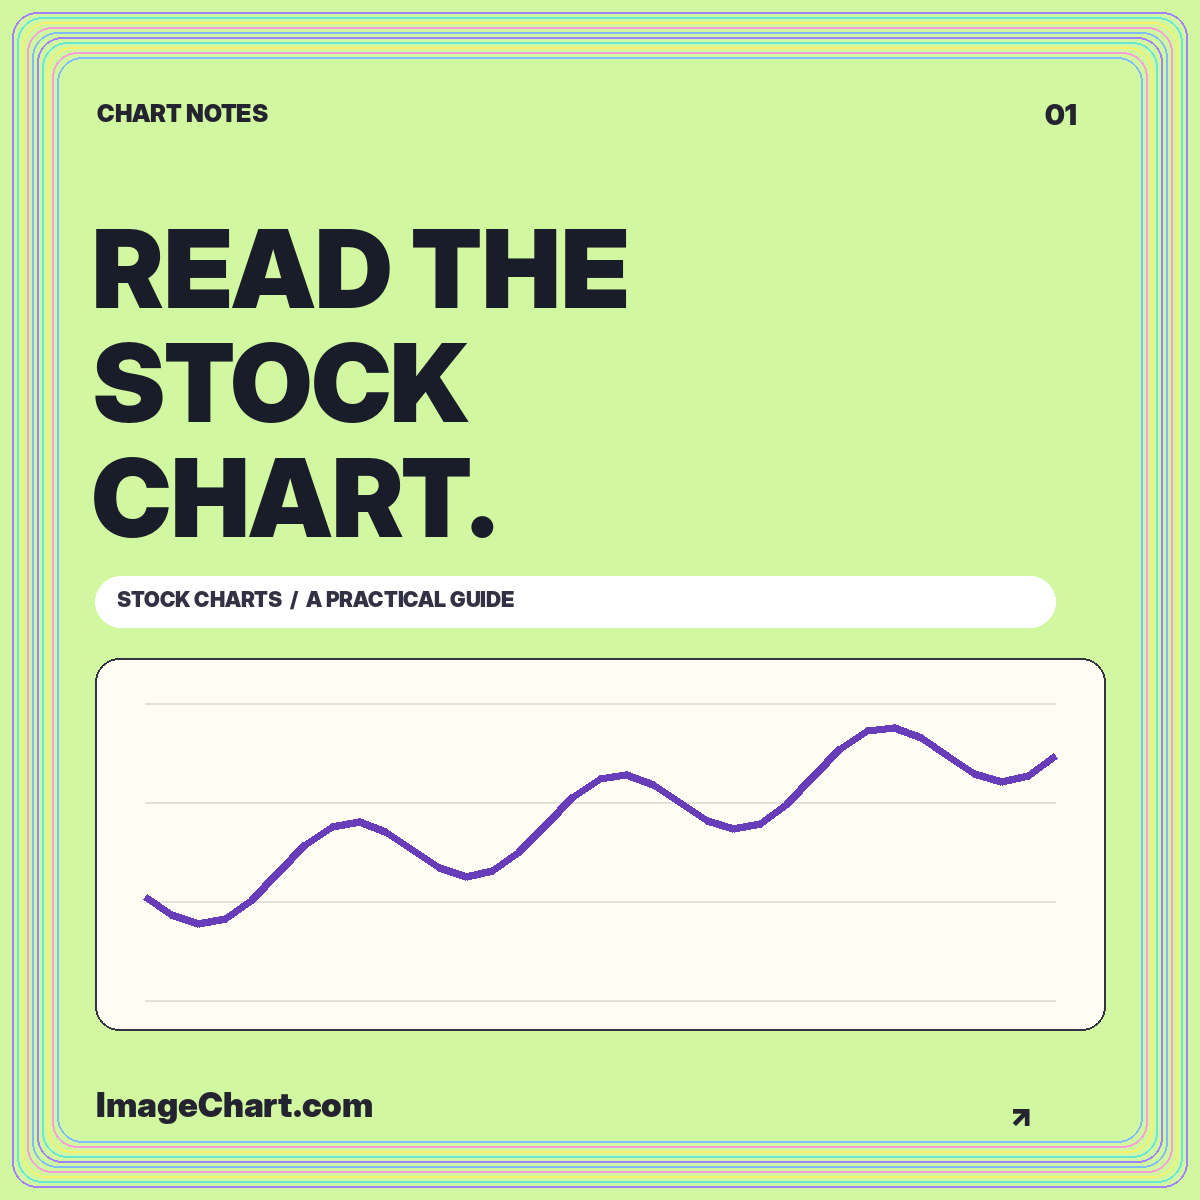
Learn a repeatable approach to chart identity, intervals, scales, price changes, and the difference between a visible pattern and an explanation.
Read the guide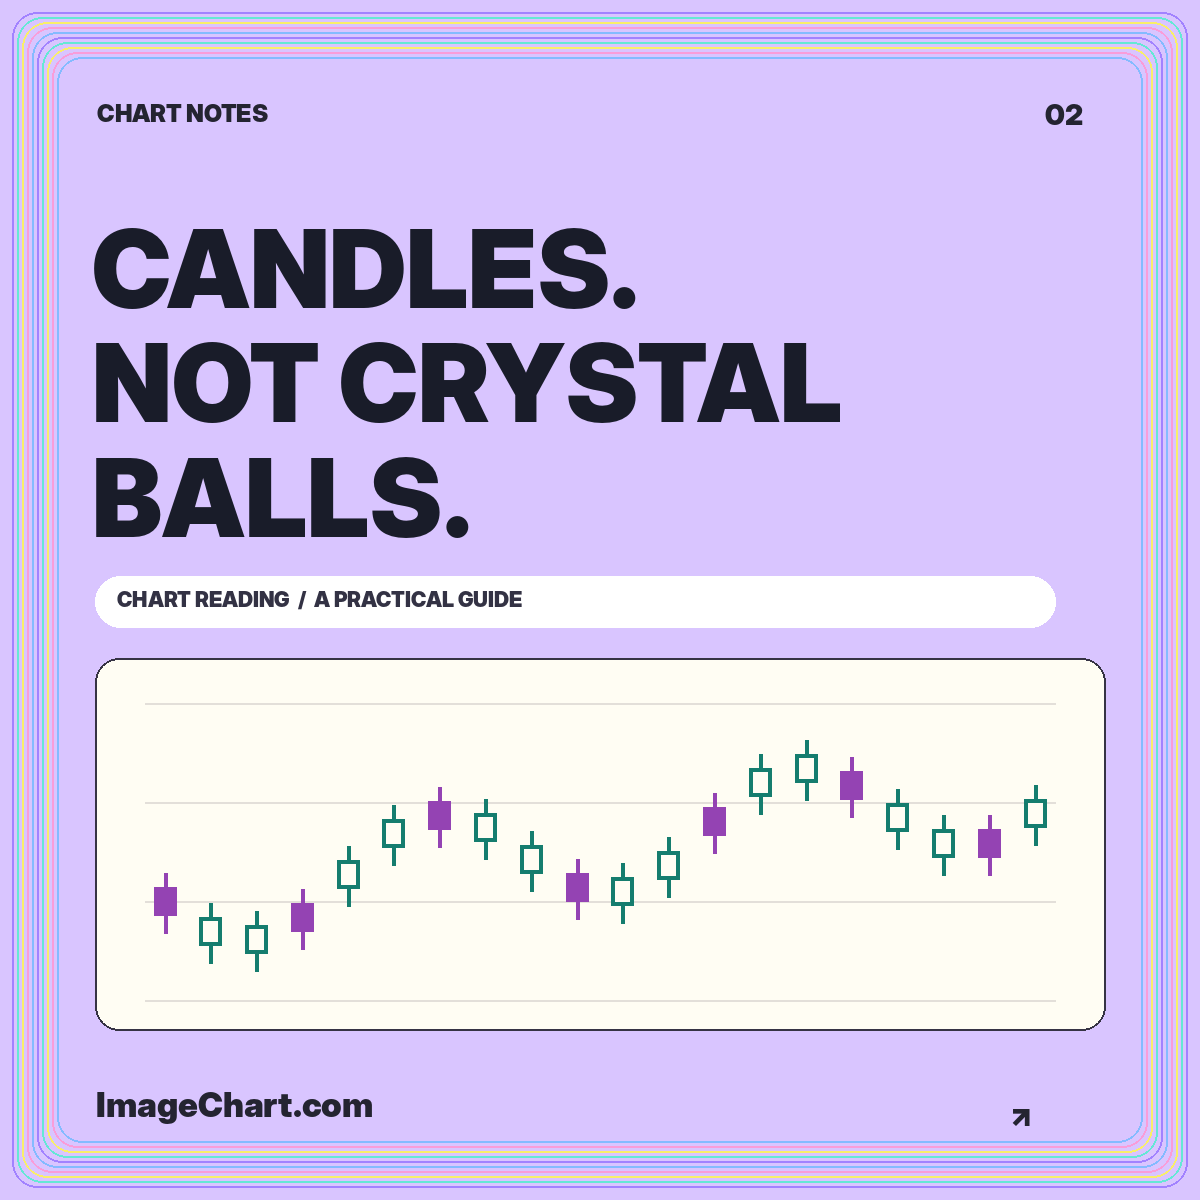
Reconstruct open, high, low, and close, understand fill conventions, and distinguish a descriptive candle pattern from a prediction.
Read the guide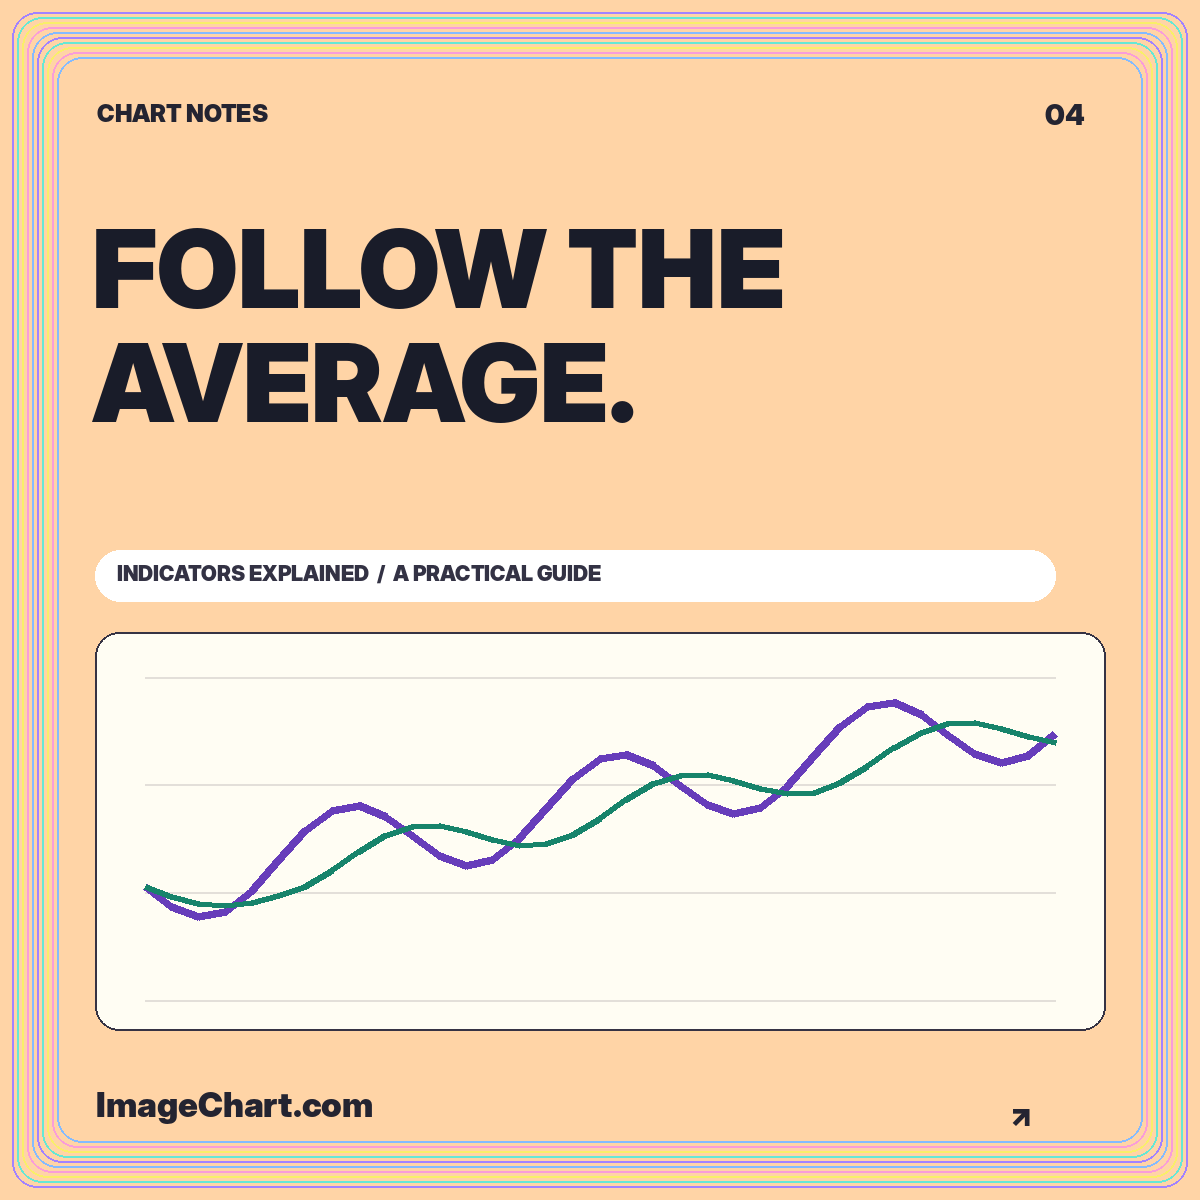
Work through a five-session simple moving average, warm-up values, smoothing, lag, and the settings a useful legend should preserve.
Read the guide