Candlestick chart patterns: read the prices before the pattern
Reconstruct open, high, low, and close, understand fill conventions, and distinguish a descriptive candle pattern from a prediction.
Read the guideExplore historical summaries with their settings intact. These guides explain what the inputs are, how a calculation transforms them, and what the resulting line does not establish. Read the numerical example before interpreting a shape, and keep averaging methods, sampling intervals, and selected fields visible in every exported legend.
Begin with the question you want to answer, then inspect the matching example and its source values. These guides use invented data to make definitions and calculations reproducible. Read the visible measure, unit, period, and limitation together; no chart example here is a live market quote or a personal recommendation. The related topic links below offer different routes through the same editorial library.
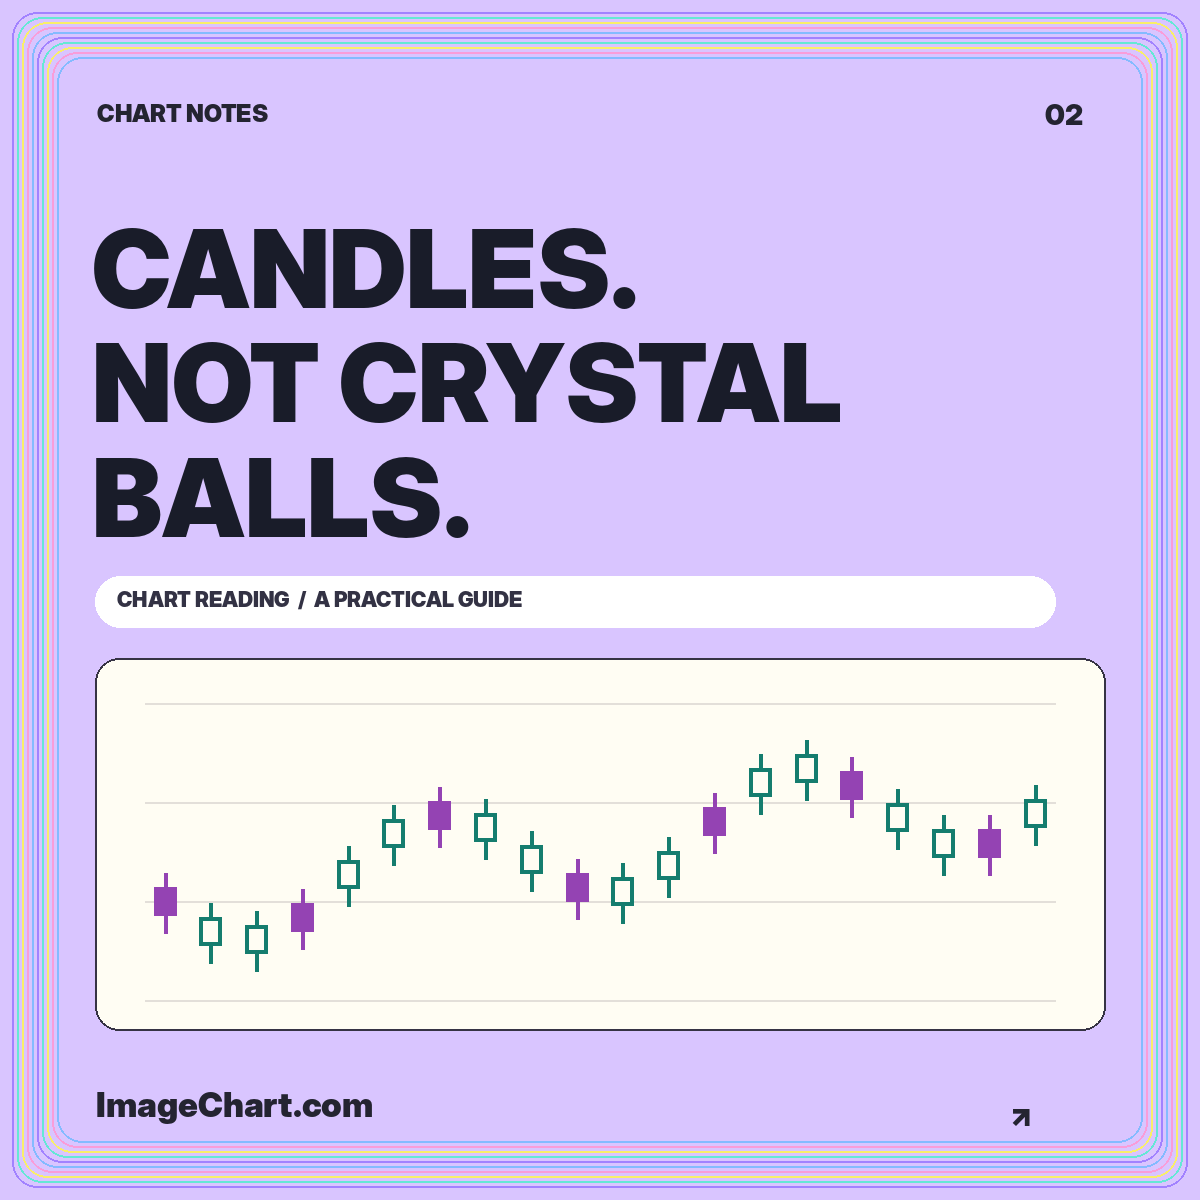
Reconstruct open, high, low, and close, understand fill conventions, and distinguish a descriptive candle pattern from a prediction.
Read the guide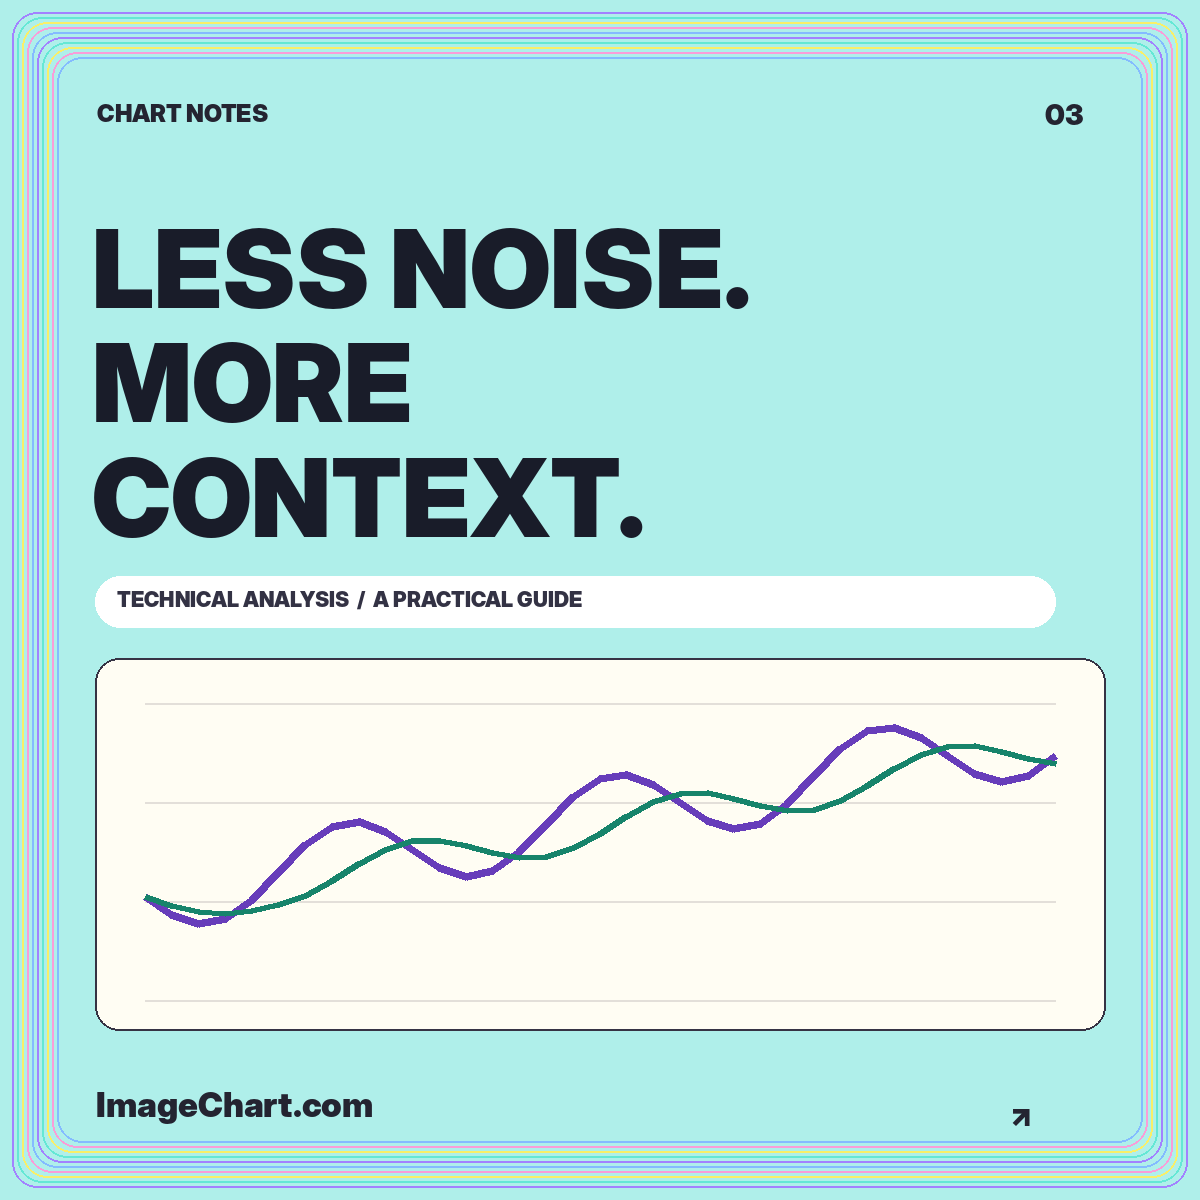
Give overlays, volume, and momentum measures separate jobs, document the settings, and keep historical summaries distinct from forecasts.
Read the guide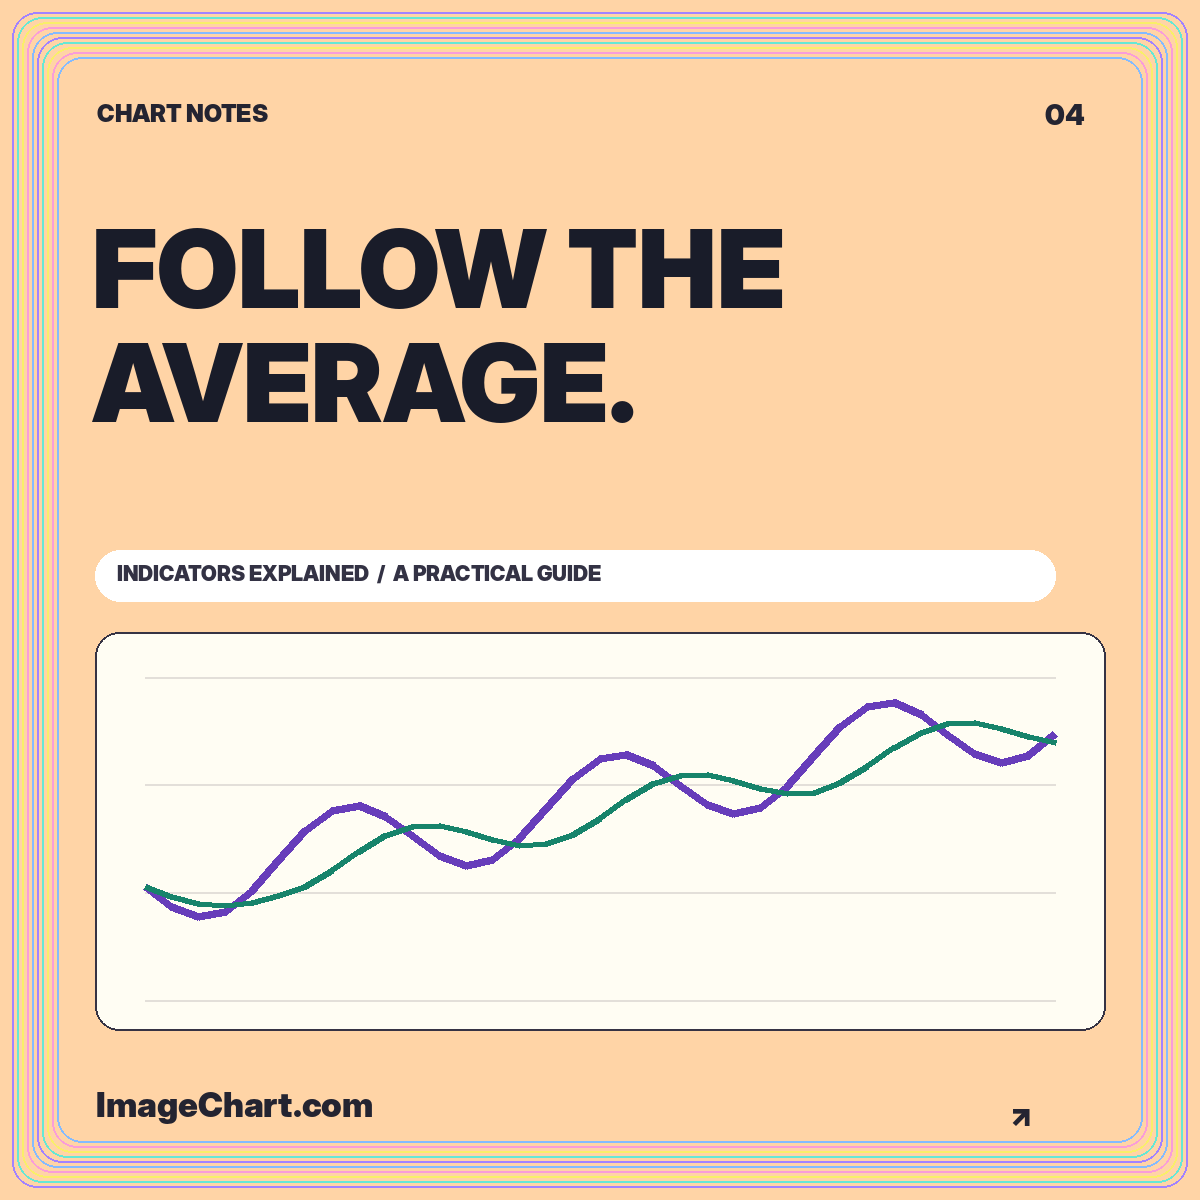
Work through a five-session simple moving average, warm-up values, smoothing, lag, and the settings a useful legend should preserve.
Read the guide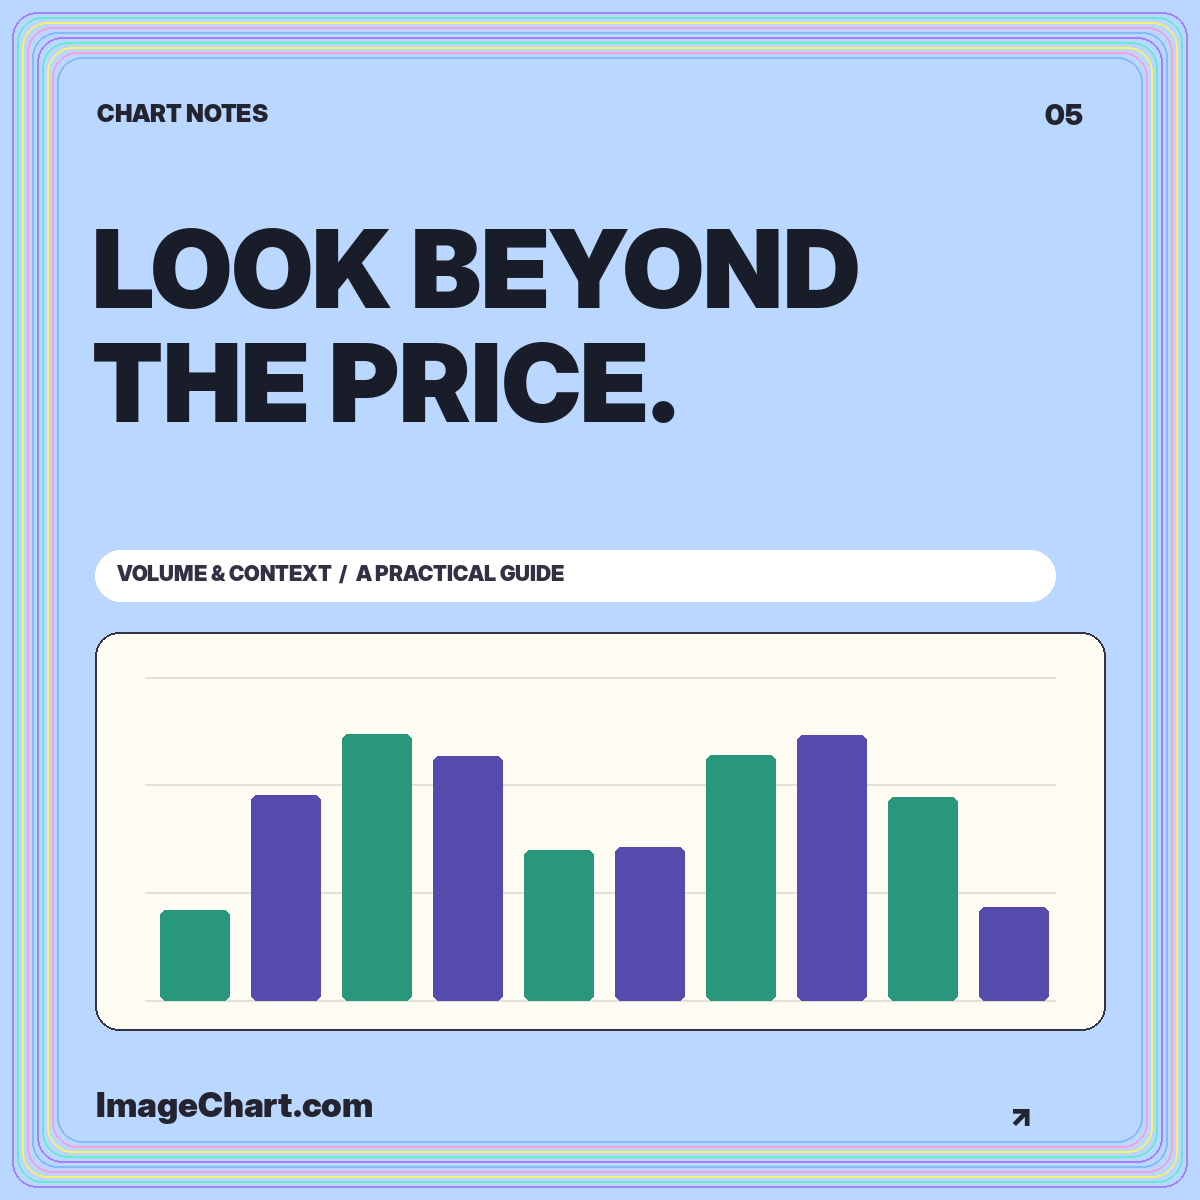
Read activity units, compare completed intervals, calculate a baseline, and avoid turning a tall volume bar into an unsupported story.
Read the guide